Ticker code: ^AXIJ
Sector: None | Industry: None | Website: None
Share Price Performance
| Last Traded Price | Change [%] | 1 Week [%] | 1 Month [%] | 3 Months [%] | 6 Months [%] | 12 Months [%] | 2 Years [%] |
|---|---|---|---|---|---|---|---|
| $2,754.500 | 0.3 | -0.2 | -5.3 | None | None | None | None |
Market Information
| Market Capitalisation | Enterprise Value | Shares Outstanding | Free Float [%] | Free Float Value | Short [%] | Days To Cover |
|---|---|---|---|---|---|---|
| None | None | None | #VALUE! | #VALUE! | None | 0.0 |
Balance Sheet
| Equity | Cash | Debt |
|---|---|---|
| #VALUE! | None | None |
Dividends
| Previous Dividend | Last Dividend | Franking [%] | Ex-Div Date | Gross Yield [%] |
|---|---|---|---|---|
| None | None | None | None | None |
Quality
| Return On Equity (ROE) | EBITDA 24 Margin [%] | Net Debt / Equity [%] | Rule of 40 |
|---|---|---|---|
| None | None | None | None |
Technicals
| Volatility [%] | Value Traded Today | Average Daily Liquidity | 3EMA Status |
|---|---|---|---|
| None | None | $23,237,512,900 | None |
Valuation
| Price To Sales | Price To Book | PER 2023 | PER 2024 | 13Y Median PER Low | PER 2025e | 13Y Median PER High | PER 2026e | Last Updated |
|---|---|---|---|---|---|---|---|---|
| None | None | None | None | None | None | None | None | None |
Income Statement
| Revenue 2024 [M] | Revenue 2025e [M] | Revenue 2026e [M] | Revenue 24 to 25e [%] | Revenue 25e to 26e [%] | EBITDA 2024 [M] | EBITDA 2025e [M] | EBITDA 2026e [M] | EBITDA 24 to 25e [%] | EBITDA 25e to 26e [%] |
|---|---|---|---|---|---|---|---|---|---|
| None | None | None | None | None | None | None | None | None | None |
Short Positions over the Last 12 Months
No chart available for this company.
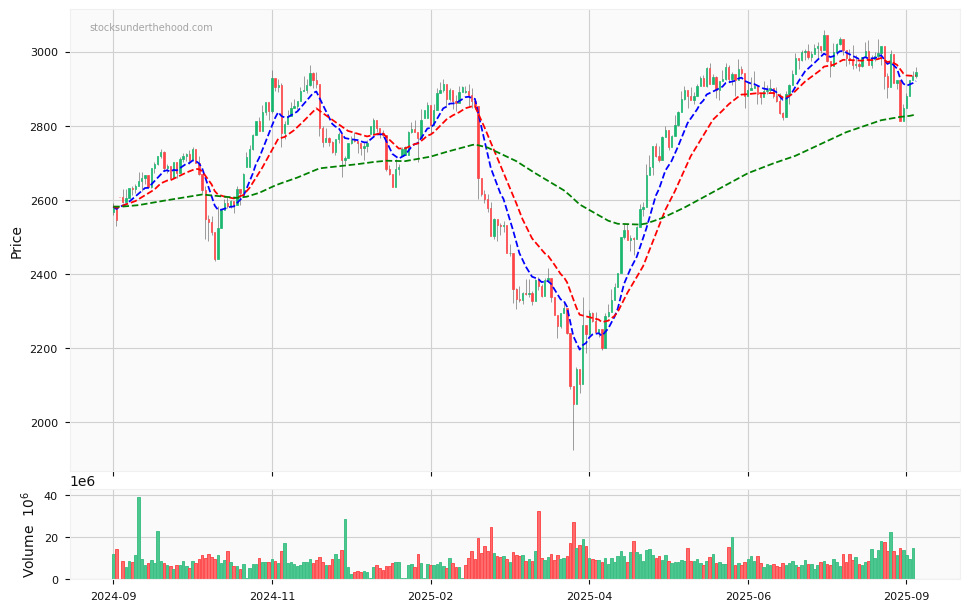
S&P ASX ALL TECHNOLOGY 1 Year Price Chart with Volume and 3EMA