Sandfire Resources Limited is a mining and exploration company, producing copper, gold, and silver, with operations and projects in Australia, Botswana, and the USA.
Ticker code: SFR
Sector: Basic Materials | Industry: Copper | Website: https://www.sandfire.com.au
Market Information
| Market Capitalisation | Enterprise Value | Shares Outstanding | Free Float [%] | Free Float Value |
|---|---|---|---|---|
| $7,665,159,404 | $7,807,733,404 | 461756580 | 99.02 | $7,589,729,650 |
Balance Sheet & Quality
| Equity | Cash | Debt | Return On Equity (ROE) | EBITDA 25 Margin [%] | Net Debt / Equity [%] | Rule of 40 |
|---|---|---|---|---|---|---|
| $1,797,618,283 | $110,668,000 | $253,242,000 | 9.4 | 44.8 | 7.9 | 69.9 |
Technicals & Short Data
| 3EMA Status | Volatility [%] | Value Traded Today | Average Daily Liquidity | Short [%] | Days To Cover |
|---|---|---|---|---|---|
| Positive | 5.1 | $19,922,441 | $28,510,816 | 4.02 | 10.8 |
Dividends
| Previous Dividend | Last Dividend | Franking [%] | Ex-Div Date | Gross Yield [%] |
|---|---|---|---|---|
| None | None | 100.0 | 2022-03-15 | 0.0 |
Price Performance Snapshot
| Last Traded Price | Change [%] | 1 Week [%] | 1 Month [%] | 3 Months [%] | 6 Months [%] | 12 Months [%] |
|---|---|---|---|---|---|---|
| $16.600 | -1.7 | 2.0 | 3.3 | 34.4 | 41.6 | 55.6 |
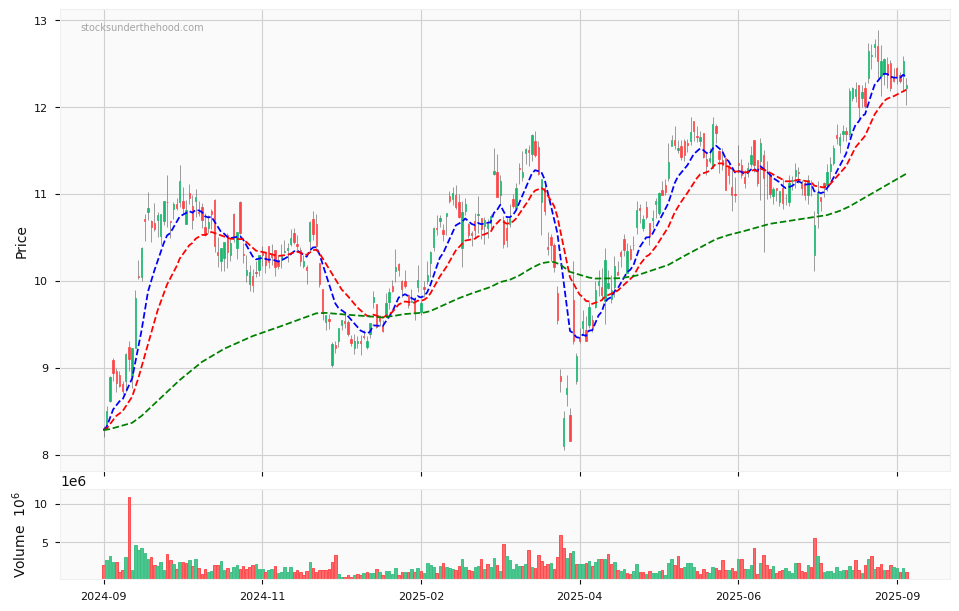
SFR Price Chart with Volume and 3EMA
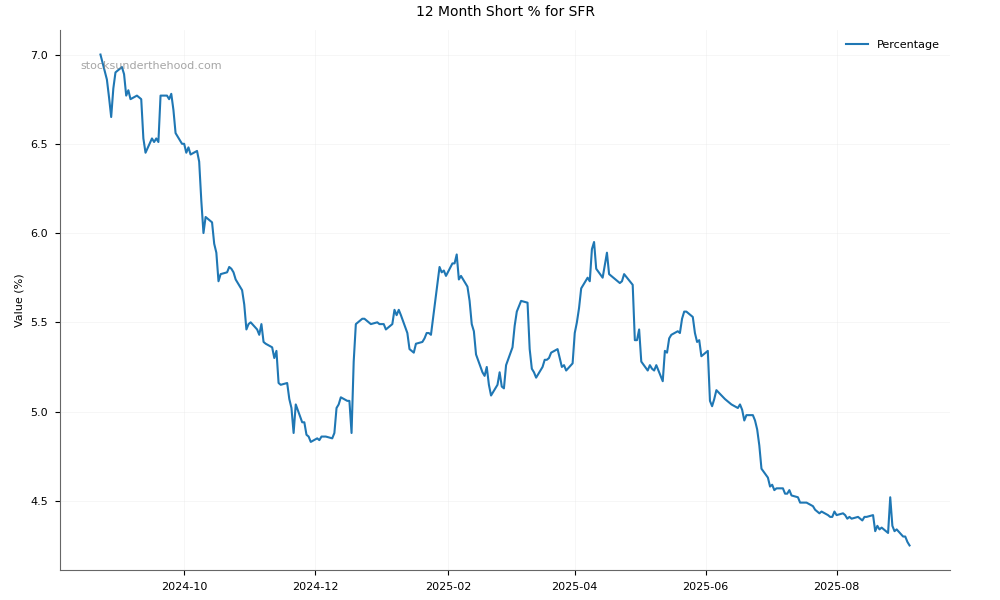
SFR Short Positions
Click HERE to understand why the above moving averages have been chosen.