Santos Limited is an Australian energy company engaged in the exploration, development, production, and marketing of natural gas, oil, and LNG, with operations across Australia and Asia.
Ticker code: STO
Sector: Energy | Industry: Oil & Gas E&P | Website: https://www.santos.com
Market Information
| Market Capitalisation | Enterprise Value | Shares Outstanding | Free Float [%] | Free Float Value |
|---|---|---|---|---|
| $20,818,224,184 | $25,777,224,376 | 3247772961 | 99.45 | $20,702,738,153 |
Balance Sheet & Quality
| Equity | Cash | Debt | Return On Equity (ROE) | EBITDA 25 Margin [%] | Net Debt / Equity [%] | Rule of 40 |
|---|---|---|---|---|---|---|
| $23,722,439,039 | $1,830,000,000 | $6,789,000,192 | 4.8 | 68.9 | 20.9 | 64.5 |
Technicals & Short Data
| 3EMA Status | Volatility [%] | Value Traded Today | Average Daily Liquidity | Short [%] | Days To Cover |
|---|---|---|---|---|---|
| Negative | 3.7 | $39,276,428 | $81,580,119 | 0.37 | 0.9 |
Dividends
| Previous Dividend | Last Dividend | Franking [%] | Ex-Div Date | Gross Yield [%] |
|---|---|---|---|---|
| $0.163 | $0.203 | None | 2025-09-02 | 3.2 |
Price Performance Snapshot
| Last Traded Price | Change [%] | 1 Week [%] | 1 Month [%] | 3 Months [%] | 6 Months [%] | 12 Months [%] |
|---|---|---|---|---|---|---|
| $6.410 | -1.4 | -1.7 | -0.2 | -17.8 | None | 2.3 |
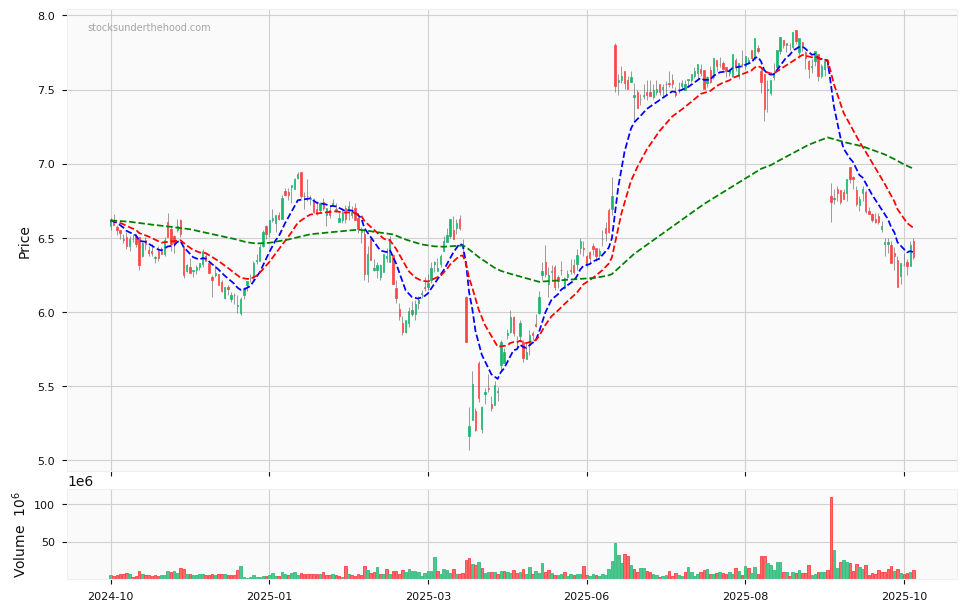
STO Price Chart with Volume and 3EMA
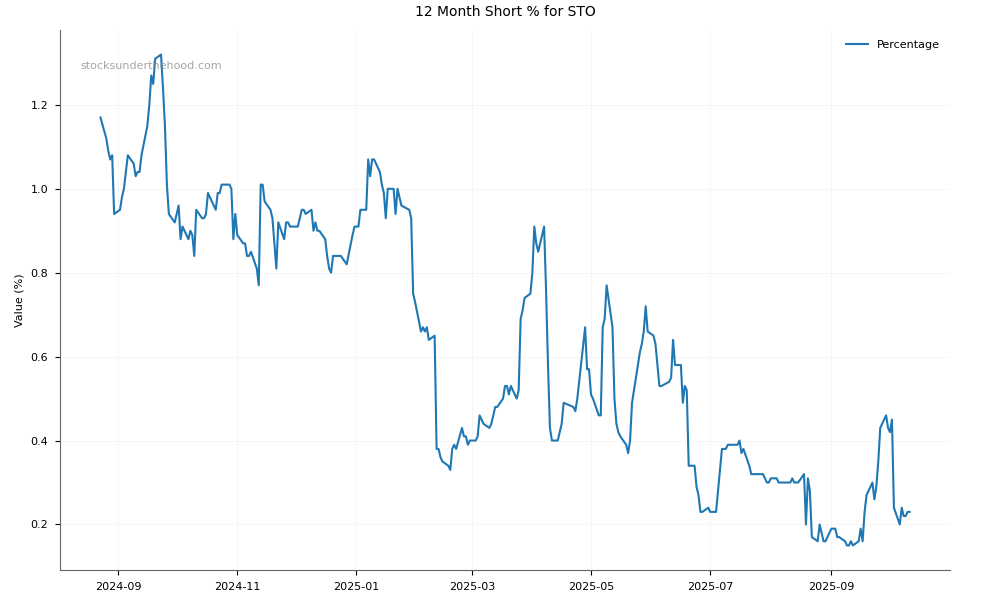
STO Short Positions
Click HERE to understand why the above moving averages have been chosen.