Ticker code: SKO
SKO Red Flags & Risk Indicators
✅
✅
⚠️ RED FLAGS: 0 identified
No red flags detected.
Income Statement
| Revenue 2024 Per Share | Revenue 2025e Per Share | Revenue 2026e Per Share | Revenue 24 to 25e [%] | Revenue 25e to 26e [%] | EBITDA 2024 Per Share | EBITDA 2025e Per Share | EBITDA 2026e Per Share | EBITDA 24 to 25e [%] | EBITDA 25e to 26e [%] |
|---|---|---|---|---|---|---|---|---|---|
| 0.58426 | 0.74241 | 0.95682 | 27.1 | 28.9 | -0.01313 | 0.02298 | 0.03563 | 275.0 | 55.1 |
SKO Revenue Per Share (2012–2027)
✅✅
✅✅

SKO Earnings before Interest, Tax, Depreciation and Amortisation (EBITDA) Per Share (2012–2027)
✅✅
✅✅

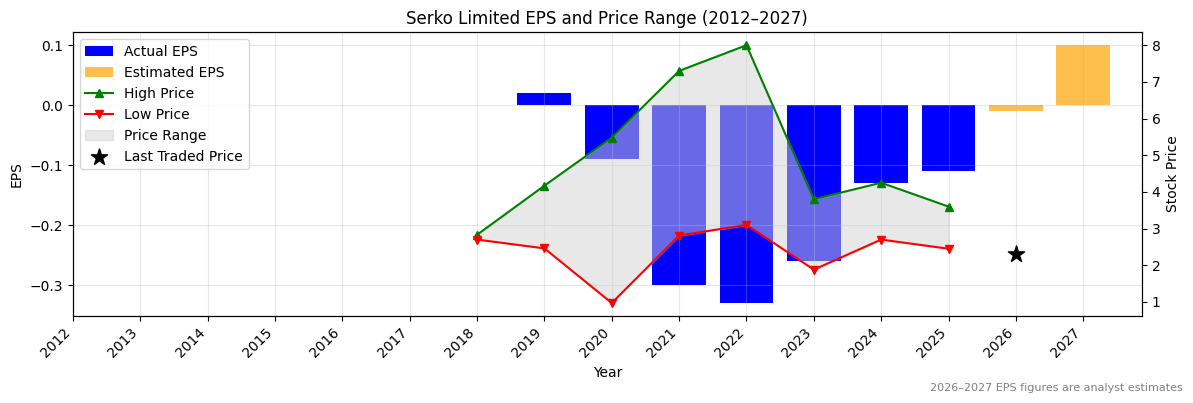
SKO Normalised Earnings Per Share (EPS) (2012–2027)
✅
✅
Valuation
| Price To Sales | Price To Book | PER 2023 | PER 2024 | 13Y Median PER Low | PER 2025e | 13Y Median PER High | PER 2026e | Last Updated |
|---|---|---|---|---|---|---|---|---|
| 3.4 | 3.0 | -9.3 | -18.7 | 123.0 | -22.1 | 208.5 | -243.0 | 11/10/25 |
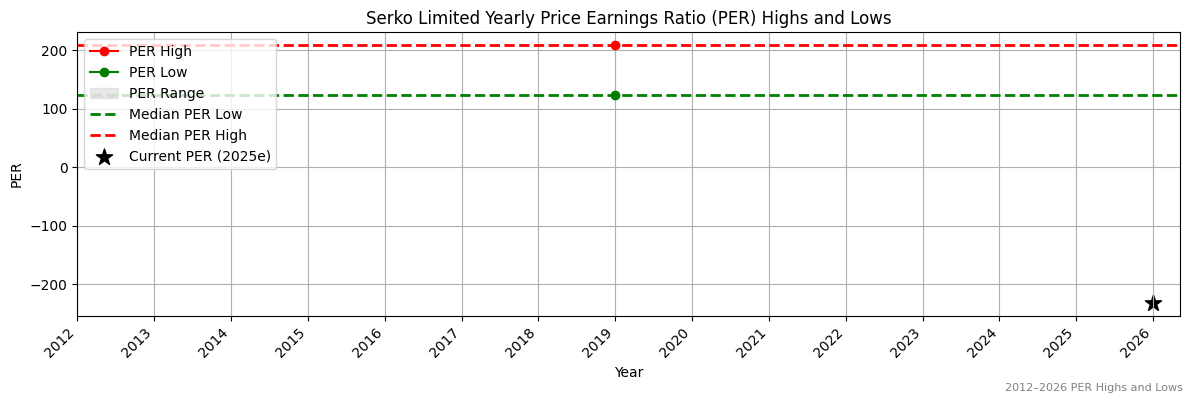
SKO Yearly Price Earnings Ratio (PER) Highs and Lows
✅✅
✅✅
SKO Weekly Price Chart with Average True Range (ATR) Trailing Stop (10-Year View)
