SKS Technologies Group Limited (ASX:SKS): Provides integrated technology solutions, including audiovisual and electrical services.
Ticker code: SKS
Sector: Industrials | Industry: Electrical Equipment & Parts | Website: https://www.sks.com.au
Market Information
| Market Capitalisation | Enterprise Value | Shares Outstanding | Free Float [%] | Free Float Value |
|---|---|---|---|---|
| $477,186,544 | $453,099,953 | 114708308 | 51.67 | $246,554,197 |
Balance Sheet & Quality
| Equity | Cash | Debt | Return On Equity (ROE) | EBITDA 25 Margin [%] | Net Debt / Equity [%] | Rule of 40 |
|---|---|---|---|---|---|---|
| $24,662,286 | $32,476,964 | $8,390,373 | 54.7 | 9.2 | -97.7 | 97.5 |
Technicals & Short Data
| 3EMA Status | Volatility [%] | Value Traded Today | Average Daily Liquidity | Short [%] | Days To Cover |
|---|---|---|---|---|---|
| Positive | 17.4 | $613,483 | $1,738,759 | 0.02 | 0.1 |
Dividends
| Previous Dividend | Last Dividend | Franking [%] | Ex-Div Date | Gross Yield [%] |
|---|---|---|---|---|
| $0.010 | $0.050 | None | 2025-09-18 | 1.2 |
Price Performance Snapshot
| Last Traded Price | Change [%] | 1 Week [%] | 1 Month [%] | 3 Months [%] | 6 Months [%] | 12 Months [%] |
|---|---|---|---|---|---|---|
| $4.160 | -1.7 | -0.5 | 22.0 | 44.1 | 151.3 | 113.8 |
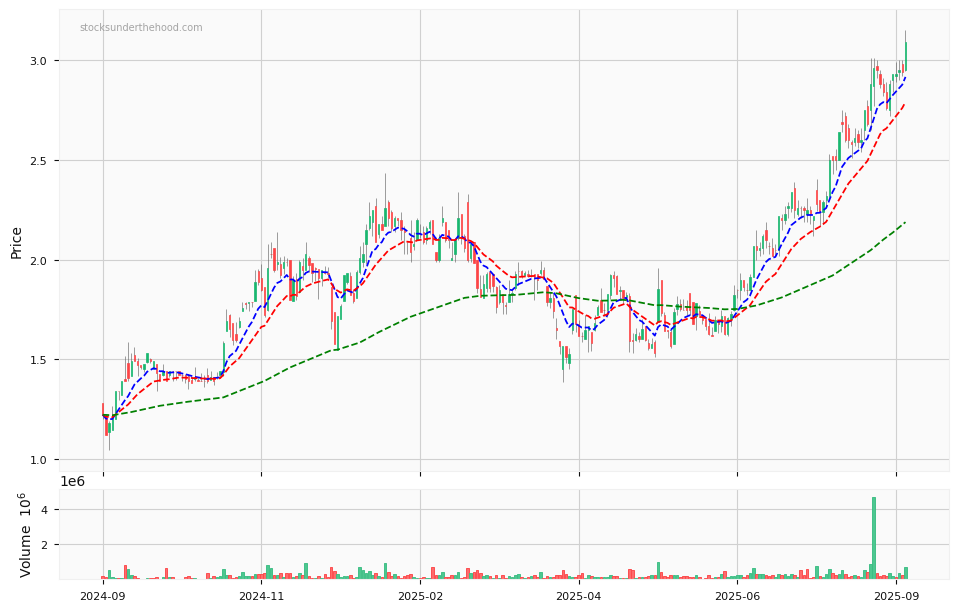
SKS Price Chart with Volume and 3EMA
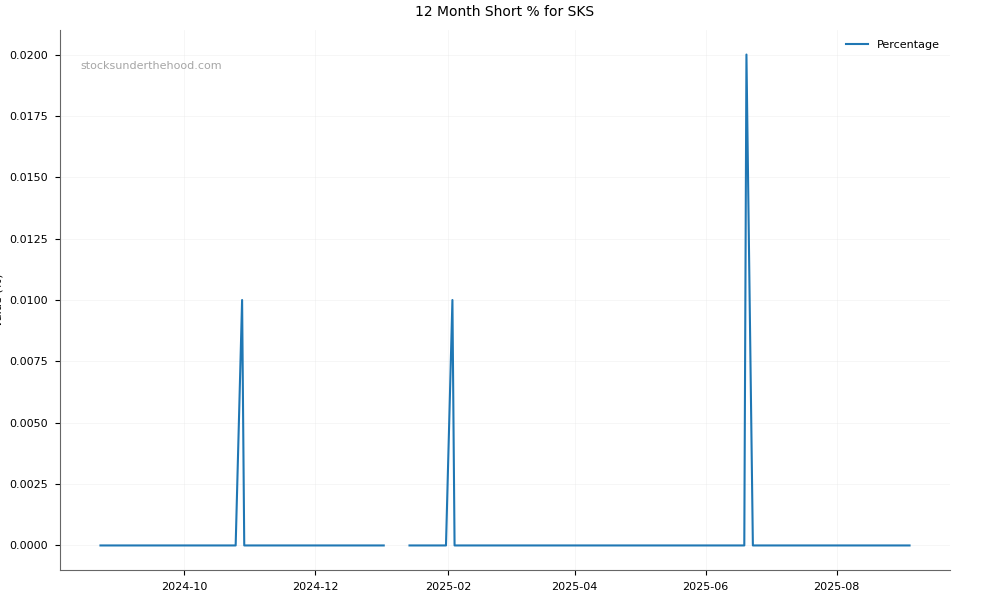
SKS Short Positions
Click HERE to understand why the above moving averages have been chosen.