Smartgroup Corporation Ltd provides outsourced employee benefits and administration services, including salary packaging, novated leasing, fleet management, payroll administration, and workforce optimization services to various sectors.
Ticker code: SIQ
Sector: Industrials | Industry: Specialty Business Services | Website: https://www.smartgroup.com.au
Market Information
| Market Capitalisation | Enterprise Value | Shares Outstanding | Free Float [%] | Free Float Value |
|---|---|---|---|---|
| $1,082,132,260 | $1,135,459,260 | 135605546 | 90.35 | $977,680,220 |
Balance Sheet & Quality
| Equity | Cash | Debt | Return On Equity (ROE) | EBITDA 25 Margin [%] | Net Debt / Equity [%] | Rule of 40 |
|---|---|---|---|---|---|---|
| $269,719,429 | $54,903,000 | $108,230,000 | 29.0 | 38.8 | 19.8 | 45.0 |
Technicals & Short Data
| 3EMA Status | Volatility [%] | Value Traded Today | Average Daily Liquidity | Short [%] | Days To Cover |
|---|---|---|---|---|---|
| Partial | 2.0 | $966,043 | $3,695,307 | 0.4 | 1.2 |
Dividends
| Previous Dividend | Last Dividend | Franking [%] | Ex-Div Date | Gross Yield [%] |
|---|---|---|---|---|
| $0.310 | $0.195 | 100.0 | 2025-09-08 | 3.5 |
Price Performance Snapshot
| Last Traded Price | Change [%] | 1 Week [%] | 1 Month [%] | 3 Months [%] | 6 Months [%] | 12 Months [%] |
|---|---|---|---|---|---|---|
| $7.980 | -2.4 | -1.2 | -3.2 | 5.9 | 5.5 | 8.0 |
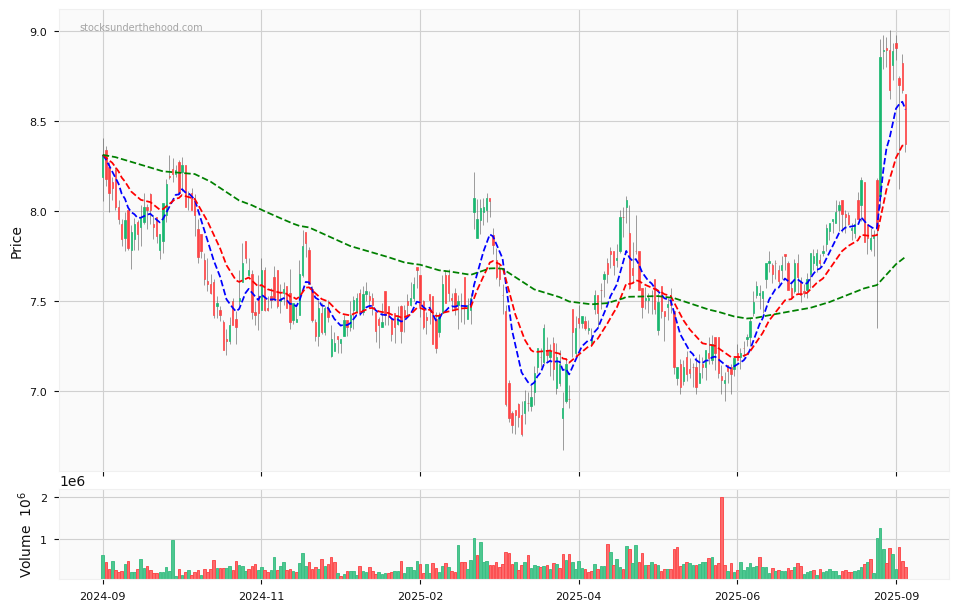
SIQ Price Chart with Volume and 3EMA
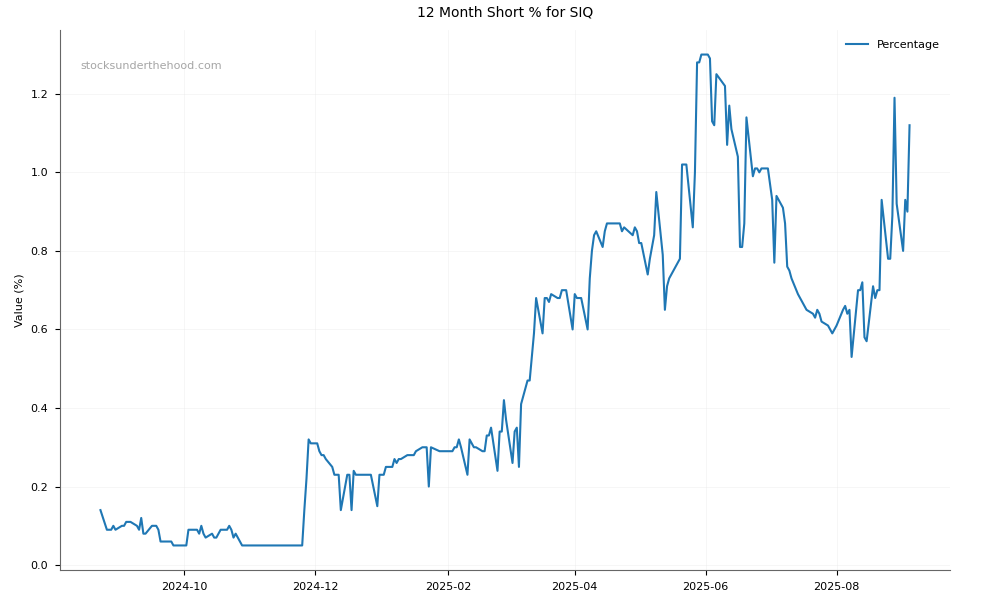
SIQ Short Positions
Click HERE to understand why the above moving averages have been chosen.