Smartpay Holdings Limited provides integrated payment solutions, including EFTPOS terminals and payment processing services, to merchants across Australia and New Zealand.
Ticker code: SMP
Sector: Technology | Industry: Software – Infrastructure | Website: https://www.smartpay.co.nz
Market Information
| Market Capitalisation | Enterprise Value | Shares Outstanding | Free Float [%] | Free Float Value |
|---|---|---|---|---|
| $252,830,920 | $261,925,920 | 241943464 | 74.12 | $187,393,222 |
Balance Sheet & Quality
| Equity | Cash | Debt | Return On Equity (ROE) | EBITDA 25 Margin [%] | Net Debt / Equity [%] | Rule of 40 |
|---|---|---|---|---|---|---|
| None | $12,079,000 | $21,174,000 | 17.9 | 15.9 | 0.0 | 28.9 |
Technicals & Short Data
| 3EMA Status | Volatility [%] | Value Traded Today | Average Daily Liquidity | Short [%] | Days To Cover |
|---|---|---|---|---|---|
| Negative | None | None | None | 0.0 | 0.0 |
Dividends
| Previous Dividend | Last Dividend | Franking [%] | Ex-Div Date | Gross Yield [%] |
|---|---|---|---|---|
| None | None | None | None | 0.0 |
Price Performance Snapshot
| Last Traded Price | Change [%] | 1 Week [%] | 1 Month [%] | 3 Months [%] | 6 Months [%] | 12 Months [%] |
|---|---|---|---|---|---|---|
| None | None | None | None | None | None | None |
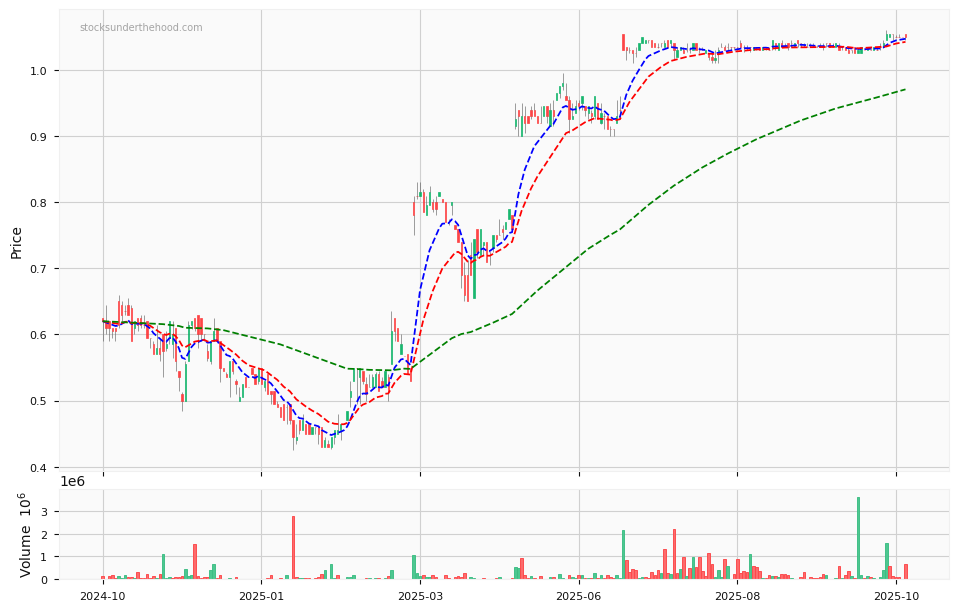
SMP Price Chart with Volume and 3EMA
SMP Short Positions

Click HERE to understand why the above moving averages have been chosen.