Stealth Global Holdings Ltd is a supplier and distributor of safety, industrial, healthcare, and workplace consumable products, serving clients across Australia, Africa, and the United Kingdom.
Ticker code: SGI
Sector: Industrials | Industry: Industrial Distribution | Website: https://www.stealthgi.com
Market Information
| Market Capitalisation | Enterprise Value | Shares Outstanding | Free Float [%] | Free Float Value |
|---|---|---|---|---|
| $189,189,715 | $205,481,831 | 149557089 | 57.57 | $108,923,754 |
Balance Sheet & Quality
| Equity | Cash | Debt | Return On Equity (ROE) | EBITDA 25 Margin [%] | Net Debt / Equity [%] | Rule of 40 |
|---|---|---|---|---|---|---|
| $34,996,358 | $14,440,724 | $30,732,840 | 9.4 | 6.7 | 46.6 | 11.8 |
Technicals & Short Data
| 3EMA Status | Volatility [%] | Value Traded Today | Average Daily Liquidity | Short [%] | Days To Cover |
|---|---|---|---|---|---|
| Positive | 26.7 | $418,430 | $220,624 | 0.0 | 0.0 |
Dividends
| Previous Dividend | Last Dividend | Franking [%] | Ex-Div Date | Gross Yield [%] |
|---|---|---|---|---|
| $0.008 | $0.010 | 100.0 | 2025-10-06 | 0.0 |
Price Performance Snapshot
| Last Traded Price | Change [%] | 1 Week [%] | 1 Month [%] | 3 Months [%] | 6 Months [%] | 12 Months [%] |
|---|---|---|---|---|---|---|
| $1.265 | 5.4 | 4.5 | 14.0 | 61.3 | 78.2 | 172.9 |
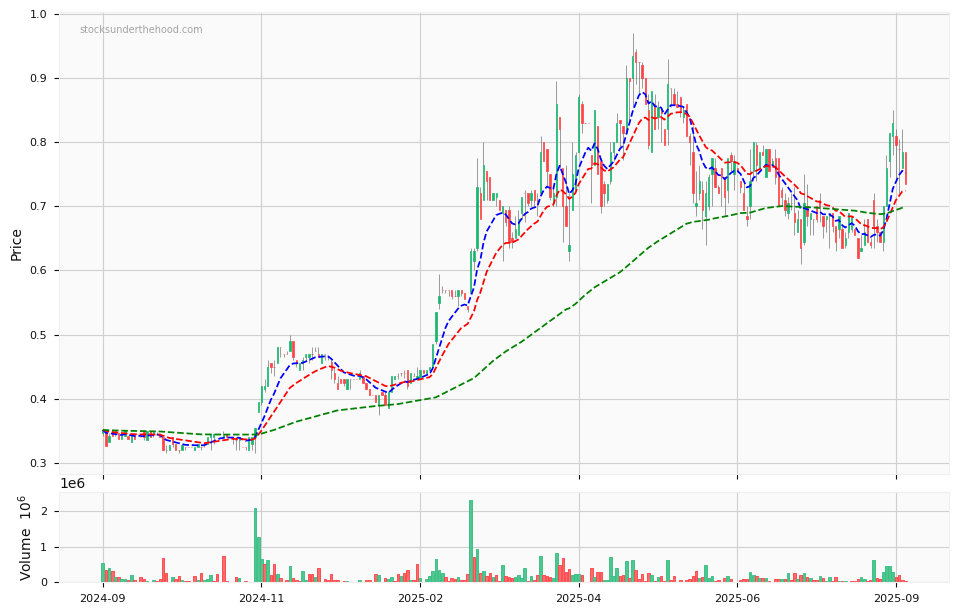
SGI Price Chart with Volume and 3EMA
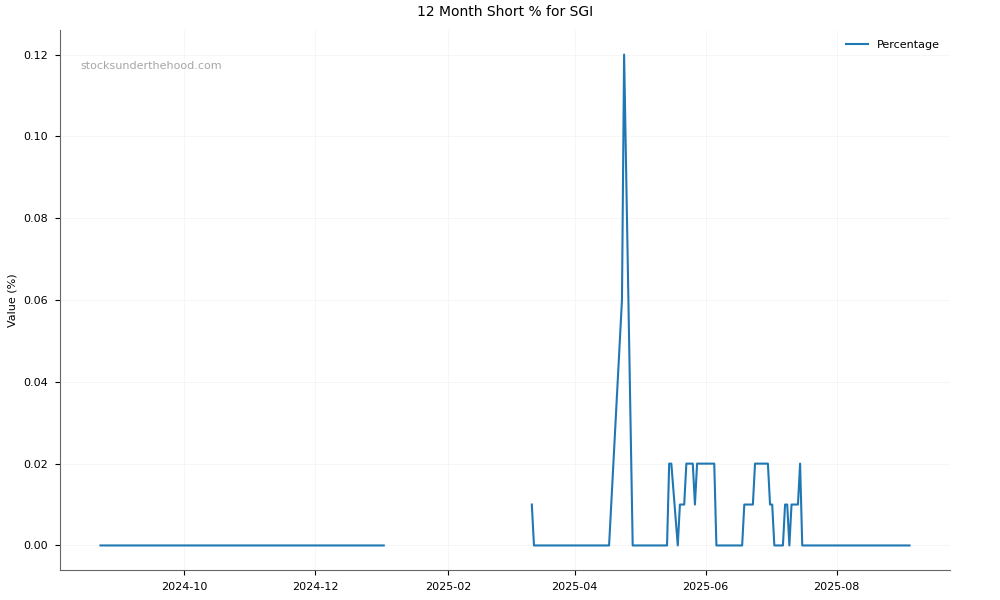
SGI Short Positions
Click HERE to understand why the above moving averages have been chosen.