Strike Energy Limited is an oil and gas exploration and development company focused on the discovery and development of gas resources in Australia, particularly in the Perth Basin.
Ticker code: STX
Sector: Energy | Industry: Oil & Gas E&P | Website: https://www.strikeenergy.com.au
Market Information
| Market Capitalisation | Enterprise Value | Shares Outstanding | Free Float [%] | Free Float Value |
|---|---|---|---|---|
| $413,930,662 | $453,637,662 | 3599396998 | 69.4 | $287,284,437 |
Balance Sheet & Quality
| Equity | Cash | Debt | Return On Equity (ROE) | EBITDA 25 Margin [%] | Net Debt / Equity [%] | Rule of 40 |
|---|---|---|---|---|---|---|
| $370,737,882 | $41,095,000 | $80,802,000 | 7.7 | 51.9 | 10.7 | 85.4 |
Technicals & Short Data
| 3EMA Status | Volatility [%] | Value Traded Today | Average Daily Liquidity | Short [%] | Days To Cover |
|---|---|---|---|---|---|
| Partial | 11.2 | $185,207 | $518,352 | 3.45 | 27.5 |
Dividends
| Previous Dividend | Last Dividend | Franking [%] | Ex-Div Date | Gross Yield [%] |
|---|---|---|---|---|
| None | None | None | None | 0.0 |
Price Performance Snapshot
| Last Traded Price | Change [%] | 1 Week [%] | 1 Month [%] | 3 Months [%] | 6 Months [%] | 12 Months [%] |
|---|---|---|---|---|---|---|
| $0.115 | -4.2 | None | 4.5 | 4.5 | -32.4 | -42.5 |
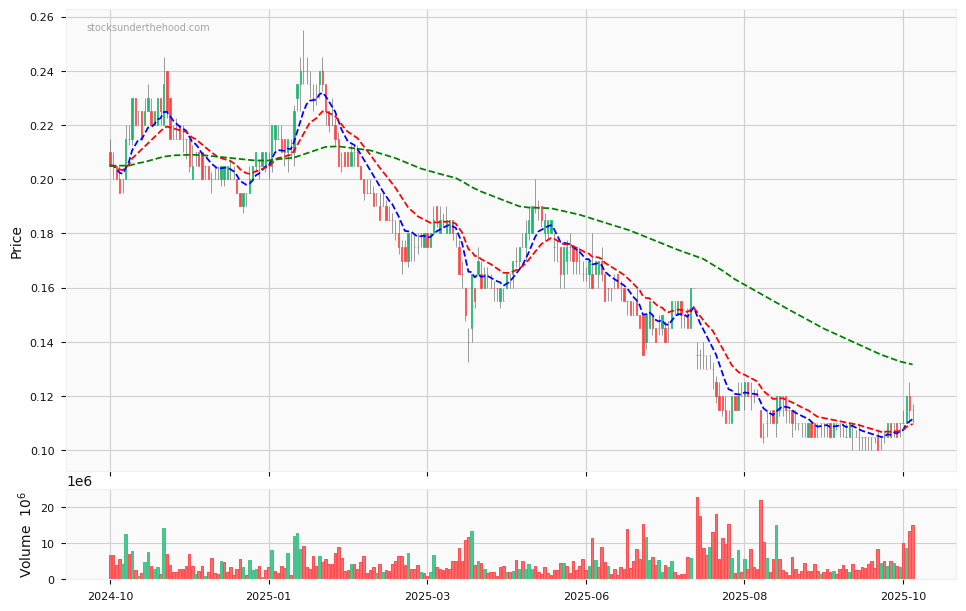
STX Price Chart with Volume and 3EMA
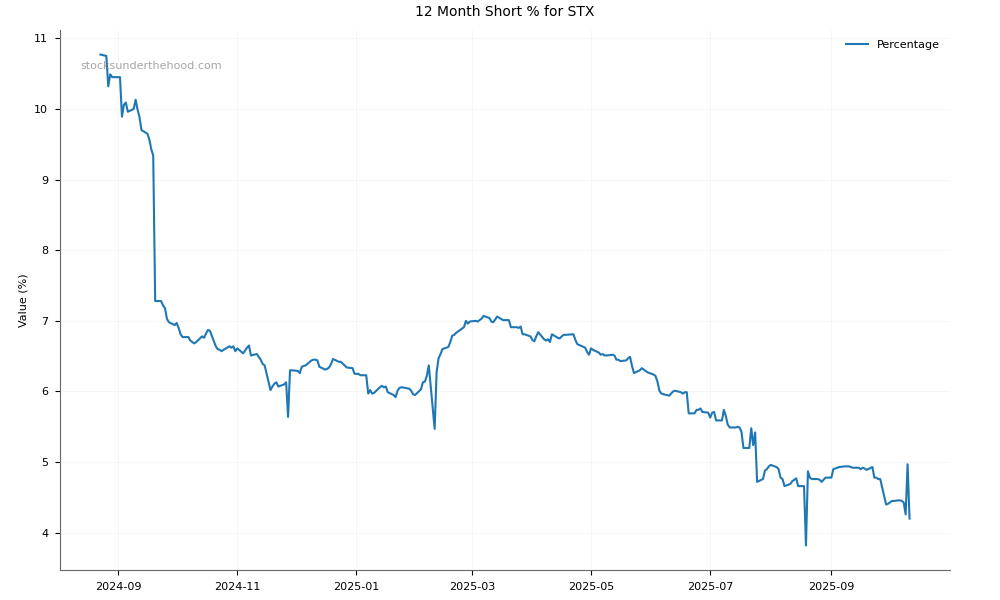
STX Short Positions
Click HERE to understand why the above moving averages have been chosen.