Suncorp Group Limited is a financial services conglomerate offering banking, insurance, and wealth management products and services to customers in Australia and New Zealand.
Ticker code: SUN
Sector: Financial Services | Industry: Insurance – Property & Casualty | Website: https://www.suncorpgroup.com.au
Market Information
| Market Capitalisation | Enterprise Value | Shares Outstanding | Free Float [%] | Free Float Value |
|---|---|---|---|---|
| $21,301,971,889 | $22,350,971,825 | 1082967555 | 99.49 | $21,192,479,759 |
Balance Sheet & Quality
| Equity | Cash | Debt | Return On Equity (ROE) | EBITDA 25 Margin [%] | Net Debt / Equity [%] | Rule of 40 |
|---|---|---|---|---|---|---|
| $10,576,261,484 | $1,479,000,064 | $2,528,000,000 | 13.2 | None | 9.9 | None |
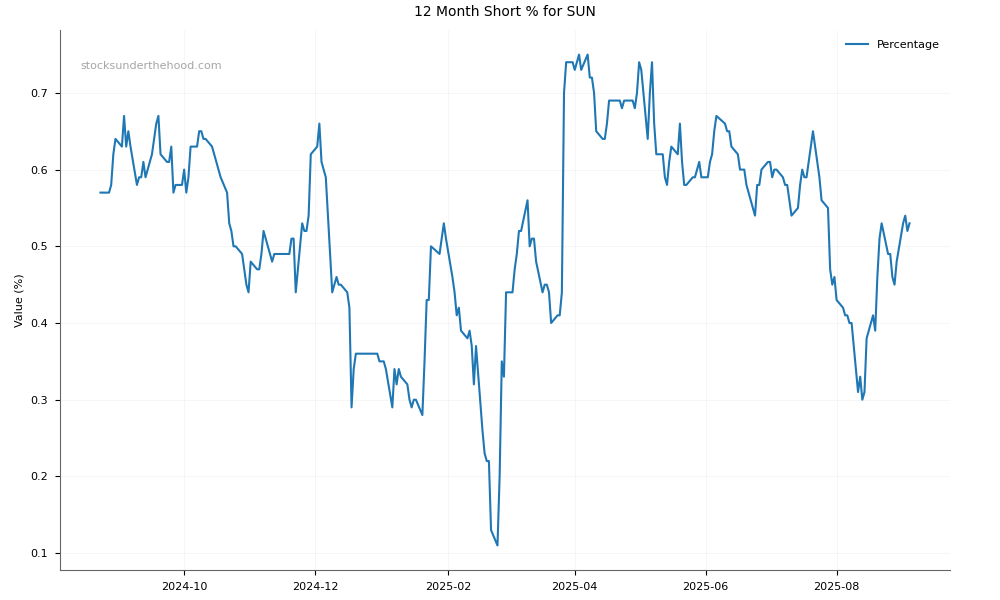
Technicals & Short Data
| 3EMA Status | Volatility [%] | Value Traded Today | Average Daily Liquidity | Short [%] | Days To Cover |
|---|---|---|---|---|---|
| Negative | 1.8 | $31,045,082 | $48,314,497 | 0.52 | 2.3 |
Dividends
| Previous Dividend | Last Dividend | Franking [%] | Ex-Div Date | Gross Yield [%] |
|---|---|---|---|---|
| $0.740 | $0.490 | 100.0 | 2025-08-19 | 3.6 |
Price Performance Snapshot
| Last Traded Price | Change [%] | 1 Week [%] | 1 Month [%] | 3 Months [%] | 6 Months [%] | 12 Months [%] |
|---|---|---|---|---|---|---|
| $19.670 | -0.7 | -0.3 | -2.4 | -0.9 | 2.3 | -1.5 |
SUN Price Chart with Volume and 3EMA

SUN Short Positions
Click HERE to understand why the above moving averages have been chosen.