Ticker code: TPW
TPW Red Flags & Risk Indicators
⚠️
⚠️
⚠️ RED FLAGS: 2 identified
- Falling Earnings
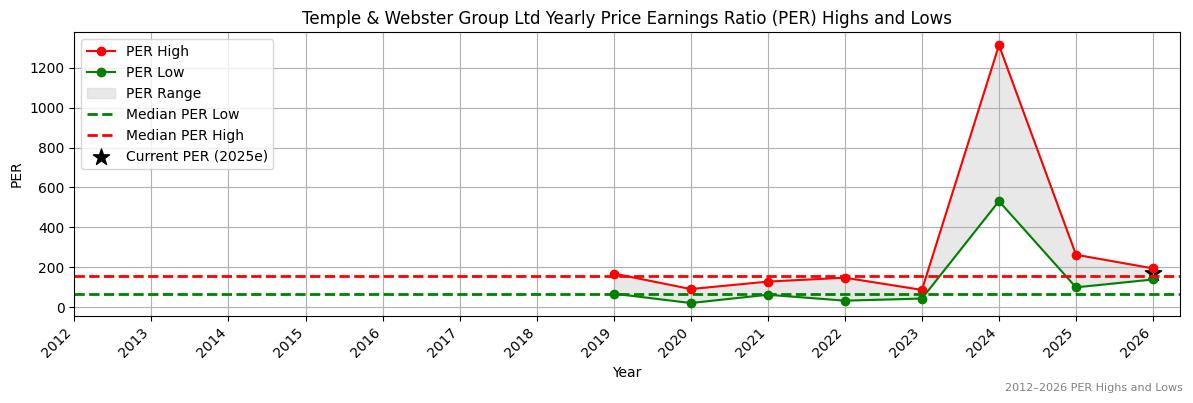
- High Relative Valuation
Income Statement
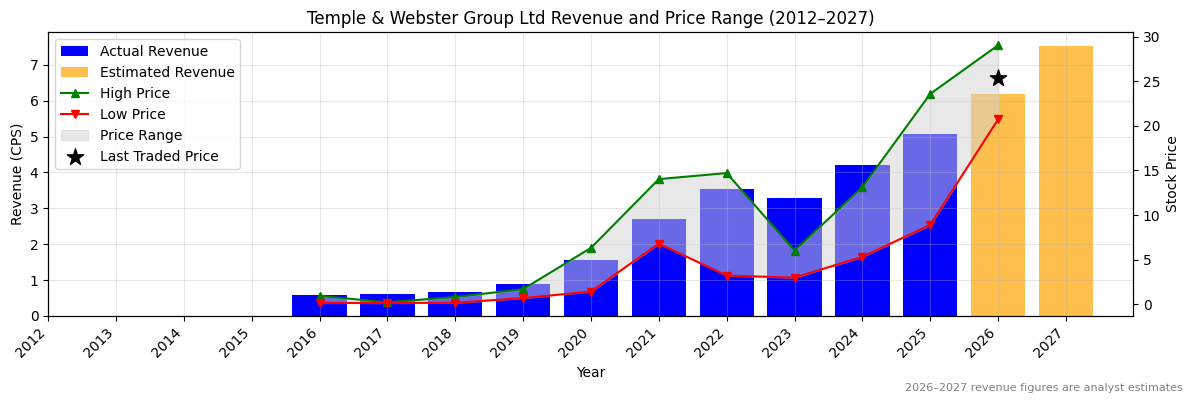
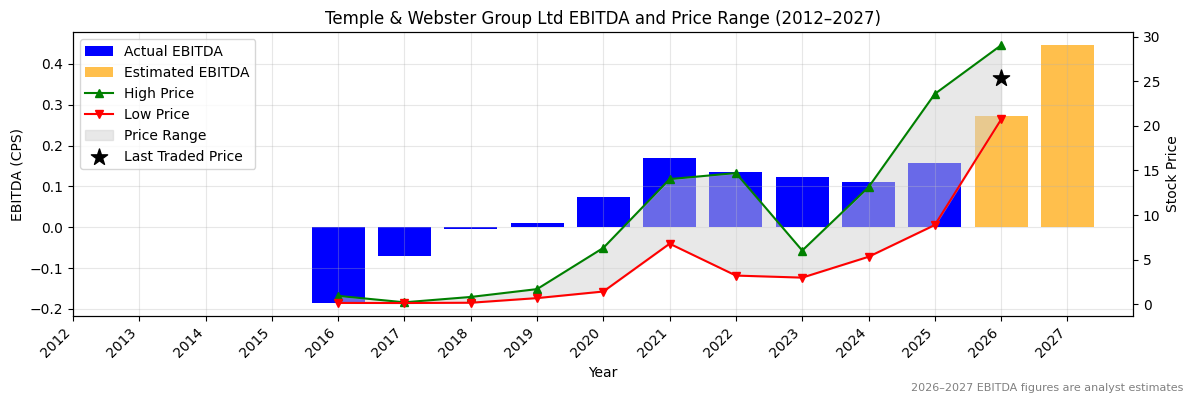
| Revenue 2024 Per Share | Revenue 2025e Per Share | Revenue 2026e Per Share | Revenue 24 to 25e [%] | Revenue 25e to 26e [%] | EBITDA 2024 Per Share | EBITDA 2025e Per Share | EBITDA 2026e Per Share | EBITDA 24 to 25e [%] | EBITDA 25e to 26e [%] |
|---|---|---|---|---|---|---|---|---|---|
| 4.19765 | 5.06509 | 6.19739 | 20.7 | 22.4 | 0.11062 | 0.15843 | 0.27329 | 43.2 | 72.5 |
TPW Revenue Per Share (2012–2027)
✅✅
✅✅
TPW Earnings before Interest, Tax, Depreciation and Amortisation (EBITDA) Per Share (2012–2027)
✅✅
✅✅
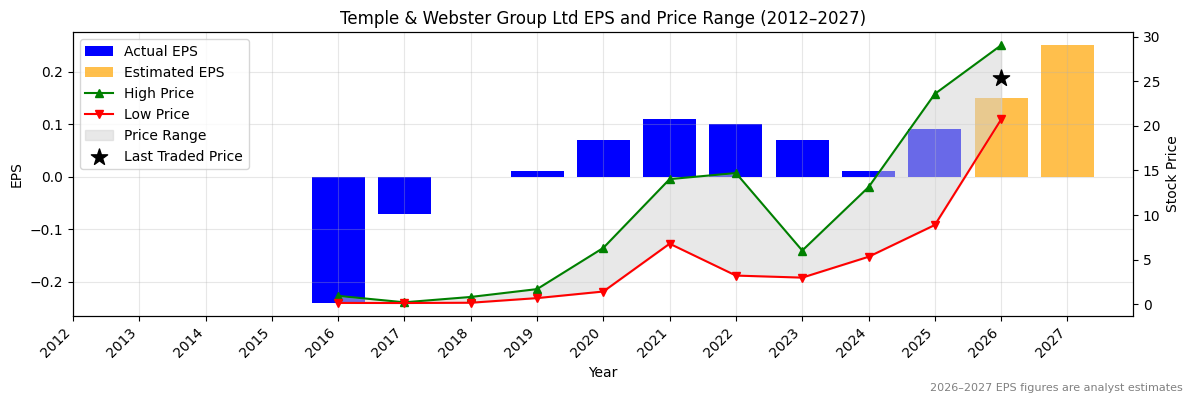
TPW Normalised Earnings Per Share (EPS) (2012–2027)
✅✅
✅✅
Valuation
| Price To Sales | Price To Book | PER 2023 | PER 2024 | 13Y Median PER Low | PER 2025e | 13Y Median PER High | PER 2026e | Last Updated |
|---|---|---|---|---|---|---|---|---|
| 4.8 | 19.1 | 340.1 | 2,381.0 | 64.3 | 264.6 | 157.6 | 158.7 | 4/10/25 |
TPW Yearly Price Earnings Ratio (PER) Highs and Lows
❌
❌
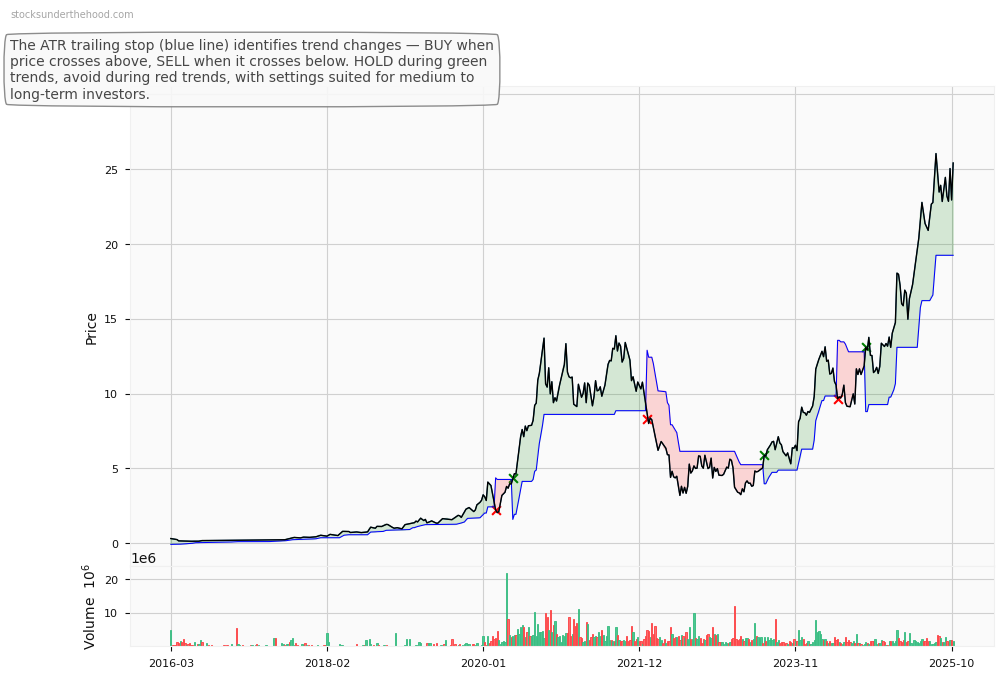
TPW Weekly Price Chart with Average True Range (ATR) Trailing Stop (10-Year View)