Environmental Group Limited provides environmental solutions, including air and water treatment technologies, to industrial and municipal clients in Australia.
Ticker code: EGL
Sector: Industrials | Industry: Pollution & Treatment Controls | Website: https://www.environmental.com.au
Market Information
| Market Capitalisation | Enterprise Value | Shares Outstanding | Free Float [%] | Free Float Value |
|---|---|---|---|---|
| $87,514,494 | $95,986,638 | 380497795 | 59.91 | $52,433,434 |
Balance Sheet & Quality
| Equity | Cash | Debt | Return On Equity (ROE) | EBITDA 25 Margin [%] | Net Debt / Equity [%] | Rule of 40 |
|---|---|---|---|---|---|---|
| $45,659,735 | $2,696,697 | $11,168,841 | 8.3 | 9.9 | 18.6 | 22.0 |
Technicals & Short Data
| 3EMA Status | Volatility [%] | Value Traded Today | Average Daily Liquidity | Short [%] | Days To Cover |
|---|---|---|---|---|---|
| Partial | 6.2 | $2,487 | $50,424 | 0.01 | 0.2 |
Dividends
| Previous Dividend | Last Dividend | Franking [%] | Ex-Div Date | Gross Yield [%] |
|---|---|---|---|---|
| None | None | None | 2019-09-20 | 0.0 |
Price Performance Snapshot
| Last Traded Price | Change [%] | 1 Week [%] | 1 Month [%] | 3 Months [%] | 6 Months [%] | 12 Months [%] |
|---|---|---|---|---|---|---|
| $0.230 | -2.1 | -4.2 | None | -6.1 | -6.1 | -14.8 |
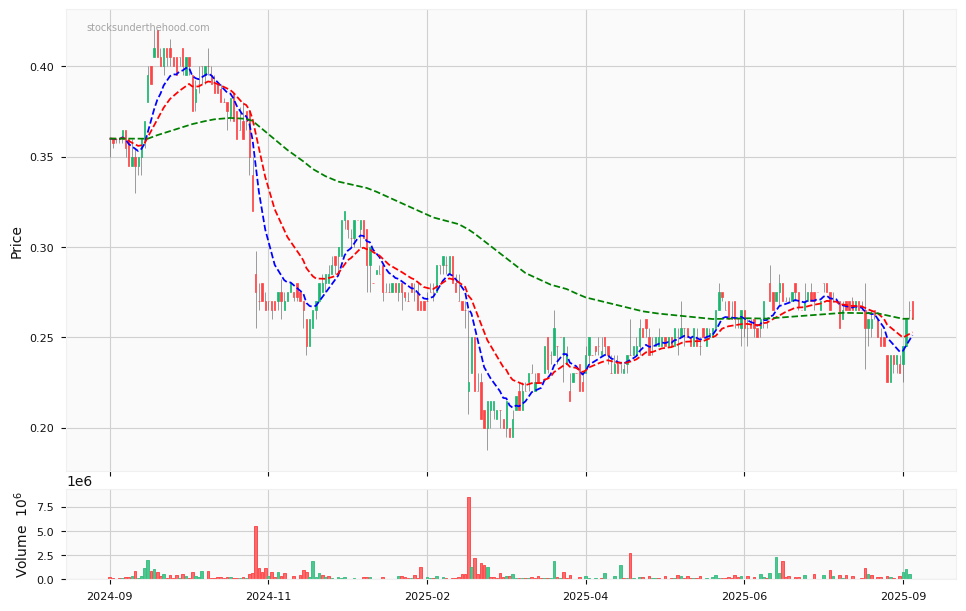
EGL Price Chart with Volume and 3EMA
EGL Short Positions

Click HERE to understand why the above moving averages have been chosen.