GPT Group is one of Australia’s largest diversified property groups, managing a substantial portfolio of retail, office, and logistics properties nationwide.
Ticker code: GPT
Sector: Real Estate | Industry: REIT – Diversified | Website: https://www.gpt.com.au
Market Information
| Market Capitalisation | Enterprise Value | Shares Outstanding | Free Float [%] | Free Float Value |
|---|---|---|---|---|
| $10,746,389,638 | $15,934,789,862 | 1915577430 | 99.96 | $10,741,876,152 |
Balance Sheet & Quality
| Equity | Cash | Debt | Return On Equity (ROE) | EBITDA 25 Margin [%] | Net Debt / Equity [%] | Rule of 40 |
|---|---|---|---|---|---|---|
| $10,206,196,091 | $61,700,000 | $5,250,100,224 | 6.2 | None | 50.8 | None |
Technicals & Short Data
| 3EMA Status | Volatility [%] | Value Traded Today | Average Daily Liquidity | Short [%] | Days To Cover |
|---|---|---|---|---|---|
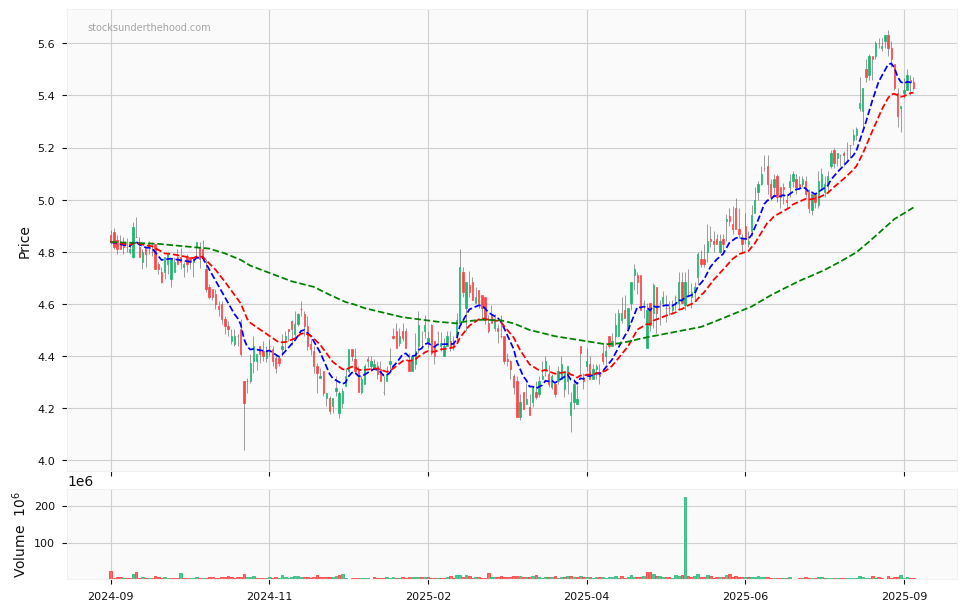
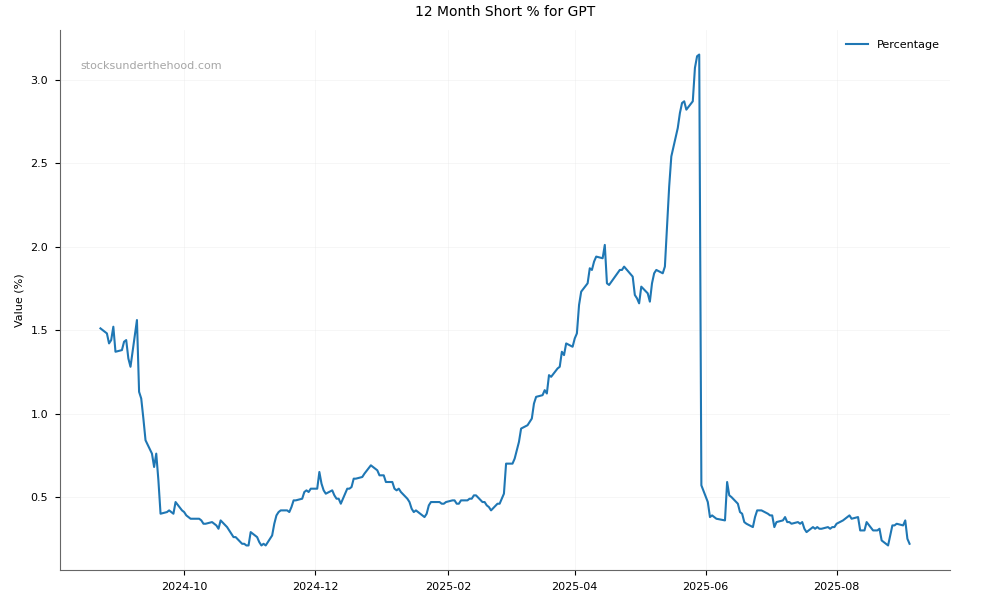
| Positive | 1.6 | $25,632,304 | $27,930,132 | 0.08 | 0.3 |
Dividends
| Previous Dividend | Last Dividend | Franking [%] | Ex-Div Date | Gross Yield [%] |
|---|---|---|---|---|
| $0.120 | $0.120 | None | 2025-06-27 | 2.1 |
Price Performance Snapshot
| Last Traded Price | Change [%] | 1 Week [%] | 1 Month [%] | 3 Months [%] | 6 Months [%] | 12 Months [%] |
|---|---|---|---|---|---|---|
| $5.610 | 1.1 | 2.2 | 6.0 | 12.9 | 26.4 | 24.3 |
GPT Price Chart with Volume and 3EMA
GPT Short Positions
Click HERE to understand why the above moving averages have been chosen.