The Star Entertainment Group Limited operates casino, hotel, and entertainment complexes in Australia, providing gaming, dining, and hospitality services in Sydney, Brisbane, and the Gold Coast.
Ticker code: SGR
Sector: Consumer Cyclical | Industry: Resorts & Casinos | Website: https://www.starentertainmentgroup.com.au
Market Information
| Market Capitalisation | Enterprise Value | Shares Outstanding | Free Float [%] | Free Float Value |
|---|---|---|---|---|
| $696,801,270 | $1,028,101,302 | 6636202776 | 29.8 | $207,670,239 |
Balance Sheet & Quality
| Equity | Cash | Debt | Return On Equity (ROE) | EBITDA 25 Margin [%] | Net Debt / Equity [%] | Rule of 40 |
|---|---|---|---|---|---|---|
| $1,035,247,682 | $267,000,000 | $598,300,032 | -16.6 | -5.7 | 32.0 | -8.4 |
Technicals & Short Data
| 3EMA Status | Volatility [%] | Value Traded Today | Average Daily Liquidity | Short [%] | Days To Cover |
|---|---|---|---|---|---|
| Partial | 19.0 | $89,236 | $989,325 | 1.67 | 11.8 |
Dividends
| Previous Dividend | Last Dividend | Franking [%] | Ex-Div Date | Gross Yield [%] |
|---|---|---|---|---|
| None | None | 100.0 | 2020-02-25 | 0.0 |
Price Performance Snapshot
| Last Traded Price | Change [%] | 1 Week [%] | 1 Month [%] | 3 Months [%] | 6 Months [%] | 12 Months [%] |
|---|---|---|---|---|---|---|
| $0.105 | None | None | 19.3 | 5.0 | -8.7 | -41.7 |
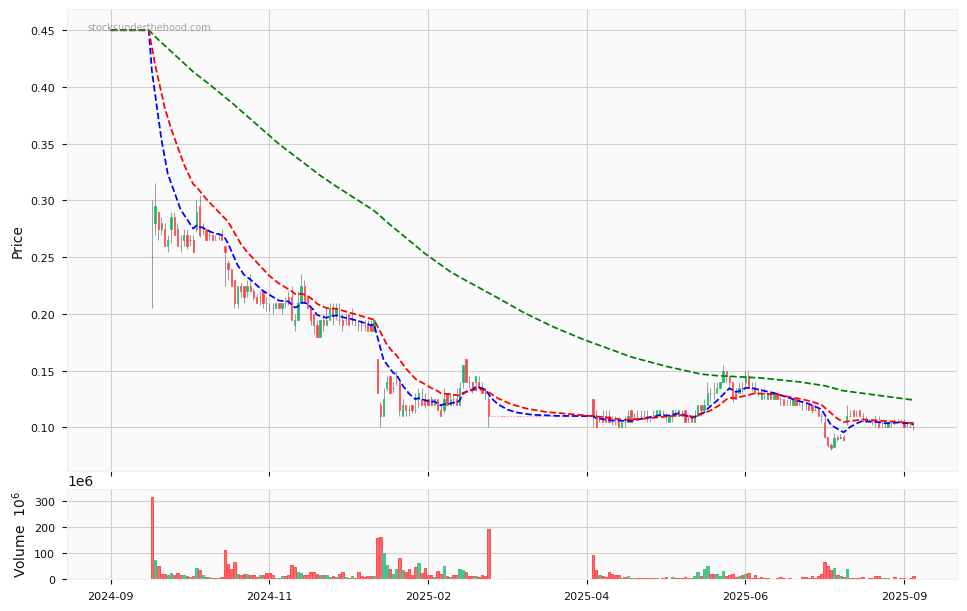
SGR Price Chart with Volume and 3EMA
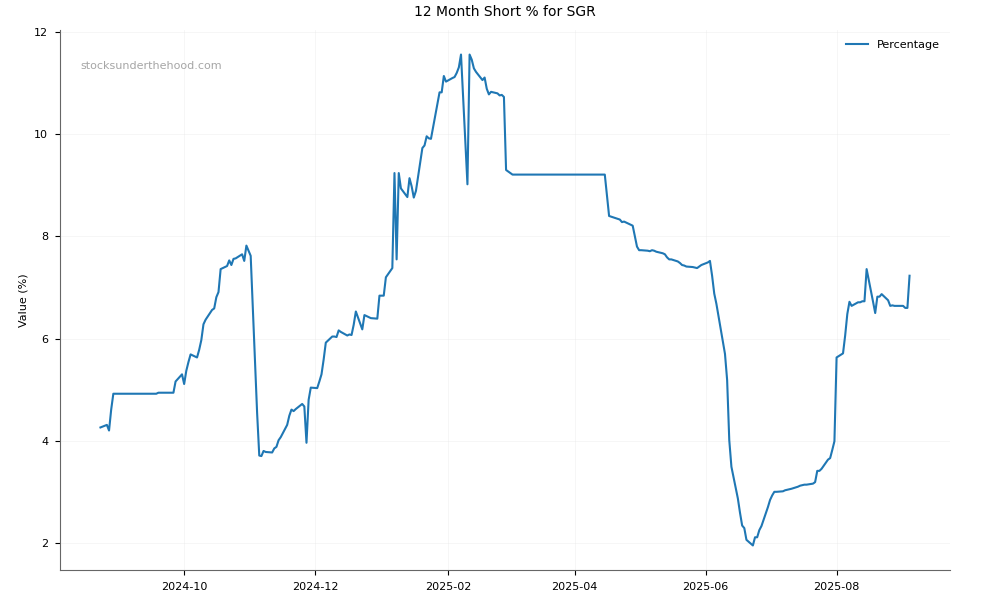
SGR Short Positions
Click HERE to understand why the above moving averages have been chosen.