Upstart is an AI-driven lending platform that uses machine learning to assess credit risk and provide personal and auto loans. It aims to make lending more accessible and efficient by analyzing non-traditional credit data.
Ticker code: UPST
Sector: Financial Services | Industry: Credit Services | Website: https://www.upstart.com
Market Information
| Market Capitalisation | Enterprise Value | Shares Outstanding | Free Float [%] | Free Float Value |
|---|---|---|---|---|
| $5,069,712,694 | $6,206,620,758 | 96217742.0 | 87.41 | $4,431,638,655 |
Balance Sheet & Quality
| Equity | Cash | Debt | Return On Equity (ROE) | EBITDA 25 Margin [%] | Net Debt / Equity [%] | Rule of 40 |
|---|---|---|---|---|---|---|
| $722,980,106 | $400,556,000 | $1,537,464,064 | 18.5 | 18.8 | 157.3 | 43.6 |
Technicals & Short Data
| 3EMA Status | Volatility [%] | Value Traded Today | Average Daily Liquidity | Short [%] | Days To Cover |
|---|---|---|---|---|---|
| Negative | 6.3 | $318,001,793 | $390,637,222 | None | 0.0 |
Dividends
| Previous Dividend | Last Dividend | Franking [%] | Ex-Div Date | Gross Yield [%] |
|---|---|---|---|---|
| None | None | None | None | 0.0 |
Price Performance Snapshot
| Last Traded Price | Change [%] | 1 Week [%] | 1 Month [%] | 3 Months [%] | 6 Months [%] | 12 Months [%] |
|---|---|---|---|---|---|---|
| $52.690 | 1.1 | 4.9 | -8.1 | -36.9 | 9.5 | 3.1 |
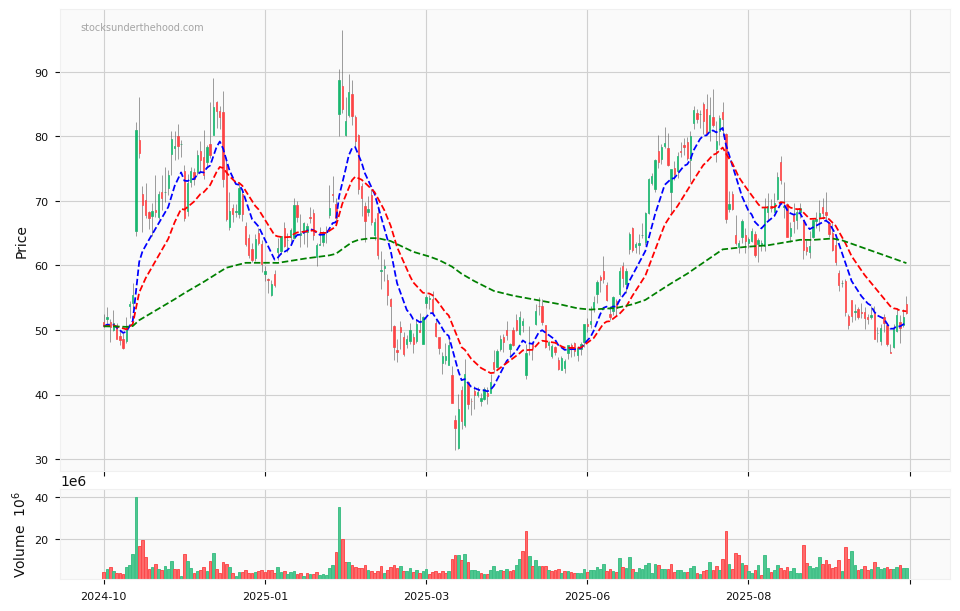
UPST Price Chart with Volume and 3EMA
UPST Short Positions
No chart available for this company.
Click HERE to understand why the above moving averages have been chosen.