Crude oil futures are contracts agreeing to buy or sell oil at a future date, serving as a benchmark for oil prices.
Ticker code: CL=F
Sector: Energy | Industry: Oil & Gas E&P | Website: N/A
Market Information
| Market Capitalisation | Enterprise Value | Shares Outstanding | Free Float [%] | Free Float Value |
|---|---|---|---|---|
| None | None | None | 0.0 | None |
Balance Sheet & Quality
| Equity | Cash | Debt | Return On Equity (ROE) | EBITDA 25 Margin [%] | Net Debt / Equity [%] | Rule of 40 |
|---|---|---|---|---|---|---|
| None | None | None | None | None | 0.0 | None |
Technicals & Short Data
| 3EMA Status | Volatility [%] | Value Traded Today | Average Daily Liquidity | Short [%] | Days To Cover |
|---|---|---|---|---|---|
| None | None | $541,834 | $14,875,560 | None | 0.0 |
Dividends
| Previous Dividend | Last Dividend | Franking [%] | Ex-Div Date | Gross Yield [%] |
|---|---|---|---|---|
| None | None | None | None | None |
Price Performance Snapshot
| Last Traded Price | Change [%] | 1 Week [%] | 1 Month [%] | 3 Months [%] | 6 Months [%] | 12 Months [%] |
|---|---|---|---|---|---|---|
| $58.640 | -0.4 | None | -2.5 | None | None | -16.6 |
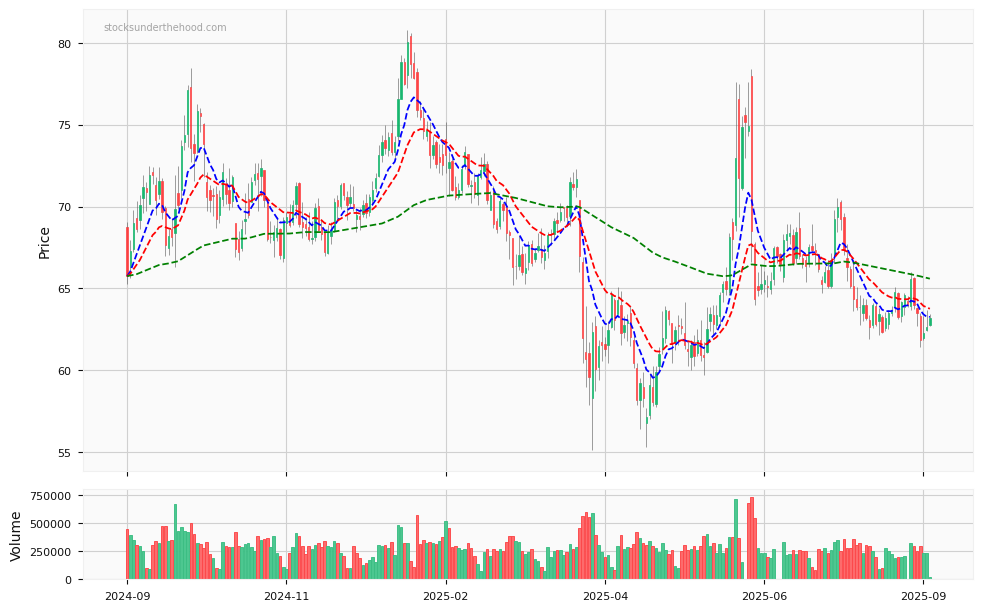
CL=F Price Chart with Volume and 3EMA
CL=F Short Positions
No chart available for this company.
Click HERE to understand why the above moving averages have been chosen.