WA1 Resources Ltd is a mineral exploration company focused on discovering and developing critical metals projects in Western Australia, targeting commodities essential for renewable energy technologies.
Ticker code: WA1
Sector: Basic Materials | Industry: Copper | Website: https://www.wa1.com.au
Market Information
| Market Capitalisation | Enterprise Value | Shares Outstanding | Free Float [%] | Free Float Value |
|---|---|---|---|---|
| $1,288,205,056 | $1,163,452,032 | 74248129.0 | 55.58 | $716,023,024 |
Balance Sheet & Quality
| Equity | Cash | Debt | Return On Equity (ROE) | EBITDA 25 Margin [%] | Net Debt / Equity [%] | Rule of 40 |
|---|---|---|---|---|---|---|
| $152,431,399 | $72,796,592 | $17,283 | None | None | -47.7 | None |
Technicals & Short Data
| 3EMA Status | Volatility [%] | Value Traded Today | Average Daily Liquidity | Short [%] | Days To Cover |
|---|---|---|---|---|---|
| Partial | 5.7 | $3,120,814 | $3,389,166 | None | 0.0 |
Dividends
| Previous Dividend | Last Dividend | Franking [%] | Ex-Div Date | Gross Yield [%] |
|---|---|---|---|---|
| None | None | None | None | None |
Price Performance Snapshot
| Last Traded Price | Change [%] | 1 Week [%] | 1 Month [%] | 3 Months [%] | 6 Months [%] | 12 Months [%] |
|---|---|---|---|---|---|---|
| $17.350 | 1.2 | 6.4 | 9.3 | -3.6 | 22.7 | 19.5 |
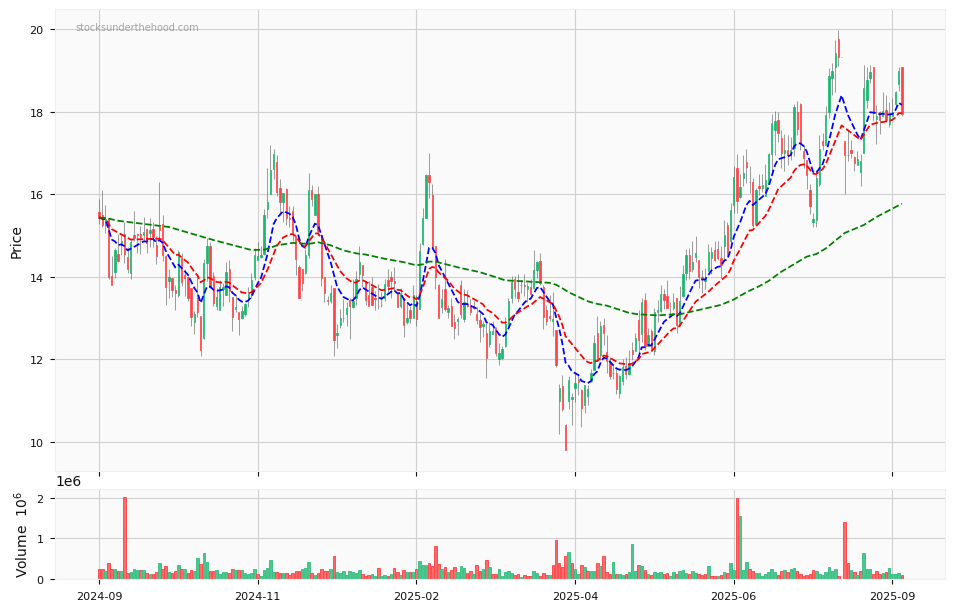
WA1 Price Chart with Volume and 3EMA
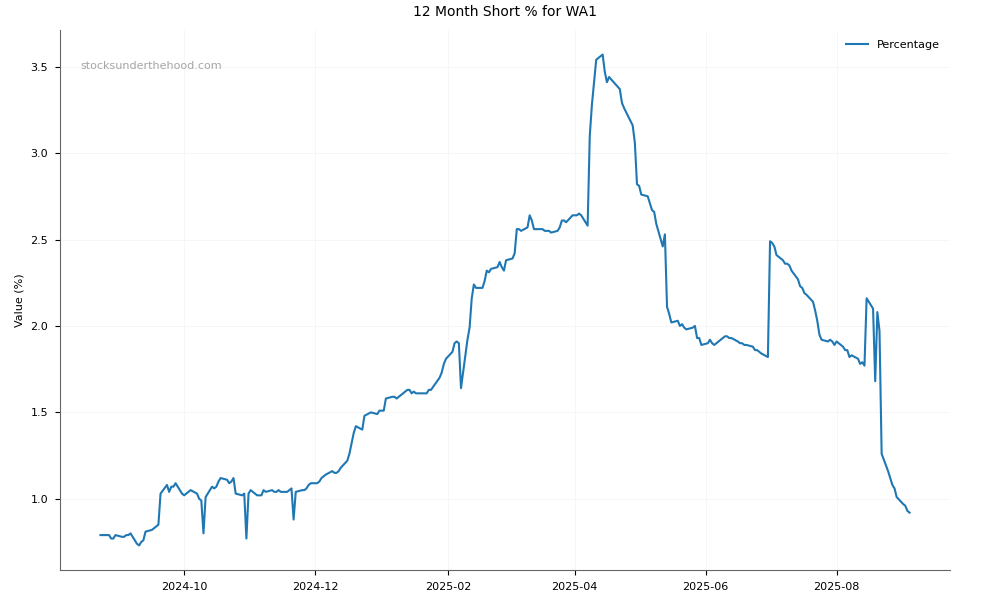
WA1 Short Positions
Click HERE to understand why the above moving averages have been chosen.