Wesfarmers Limited is a diversified conglomerate with business operations in retail, chemicals, fertilizers, industrial and safety products, and resources, owning brands such as Bunnings, Kmart, and Officeworks.
Ticker code: WES
Sector: Consumer Cyclical | Industry: Home Improvement Retail | Website: https://www.wesfarmers.com.au
Market Information
| Market Capitalisation | Enterprise Value | Shares Outstanding | Free Float [%] | Free Float Value |
|---|---|---|---|---|
| $91,401,614,856 | $101,931,614,856 | 1135282728.0 | 99.66 | $91,091,218,849 |
Balance Sheet & Quality
| Equity | Cash | Debt | Return On Equity (ROE) | EBITDA 25 Margin [%] | Net Debt / Equity [%] | Rule of 40 |
|---|---|---|---|---|---|---|
| $9,191,248,282 | $638,000,000 | $11,168,000,000 | 28.8 | 13.1 | 114.6 | 16.7 |
Technicals & Short Data
| 3EMA Status | Volatility [%] | Value Traded Today | Average Daily Liquidity | Short [%] | Days To Cover |
|---|---|---|---|---|---|
| Negative | 2.0 | $74,564,499 | $117,892,245 | 0.32 | 2.5 |
Dividends
| Previous Dividend | Last Dividend | Franking [%] | Ex-Div Date | Gross Yield [%] |
|---|---|---|---|---|
| $0.950 | $1.110 | 100.0 | 2025-09-02 | 2.0 |
Price Performance Snapshot
| Last Traded Price | Change [%] | 1 Week [%] | 1 Month [%] | 3 Months [%] | 6 Months [%] | 12 Months [%] |
|---|---|---|---|---|---|---|
| $80.510 | -0.1 | -1.4 | -0.4 | -13.0 | -3.1 | 11.2 |
WES Price Chart with Volume and 3EMA
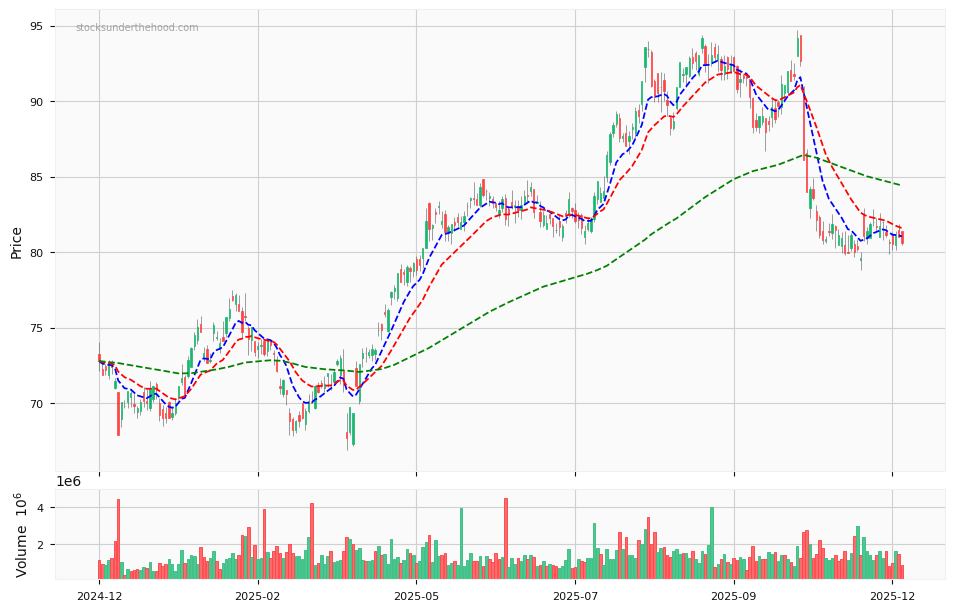
WES Short Positions

Click HERE to understand why the above moving averages have been chosen.