West African Resources Limited is a gold exploration and production company, operating the Sanbrado Gold Project in Burkina Faso, West Africa.
Ticker code: WAF
Sector: Basic Materials | Industry: Gold | Website: https://www.westafricanresources.com
Market Information
| Market Capitalisation | Enterprise Value | Shares Outstanding | Free Float [%] | Free Float Value |
|---|---|---|---|---|
| $3,129,103,663 | $3,280,771,663 | 1142008632.0 | 92.26 | $2,886,959,902 |
Balance Sheet & Quality
| Equity | Cash | Debt | Return On Equity (ROE) | EBITDA 25 Margin [%] | Net Debt / Equity [%] | Rule of 40 |
|---|---|---|---|---|---|---|
| $1,450,351,045 | $279,235,008 | $430,903,008 | 36.2 | 60.0 | 10.5 | 141.6 |
Technicals & Short Data
| 3EMA Status | Volatility [%] | Value Traded Today | Average Daily Liquidity | Short [%] | Days To Cover |
|---|---|---|---|---|---|
| Partial | 13.4 | $10,177,283 | $10,703,161 | 0.4 | 1.2 |
Dividends
| Previous Dividend | Last Dividend | Franking [%] | Ex-Div Date | Gross Yield [%] |
|---|---|---|---|---|
| None | None | None | None | 0.0 |
Price Performance Snapshot
| Last Traded Price | Change [%] | 1 Week [%] | 1 Month [%] | 3 Months [%] | 6 Months [%] | 12 Months [%] |
|---|---|---|---|---|---|---|
| $2.740 | -0.7 | -7.7 | -9.9 | -9.9 | 14.2 | 67.1 |
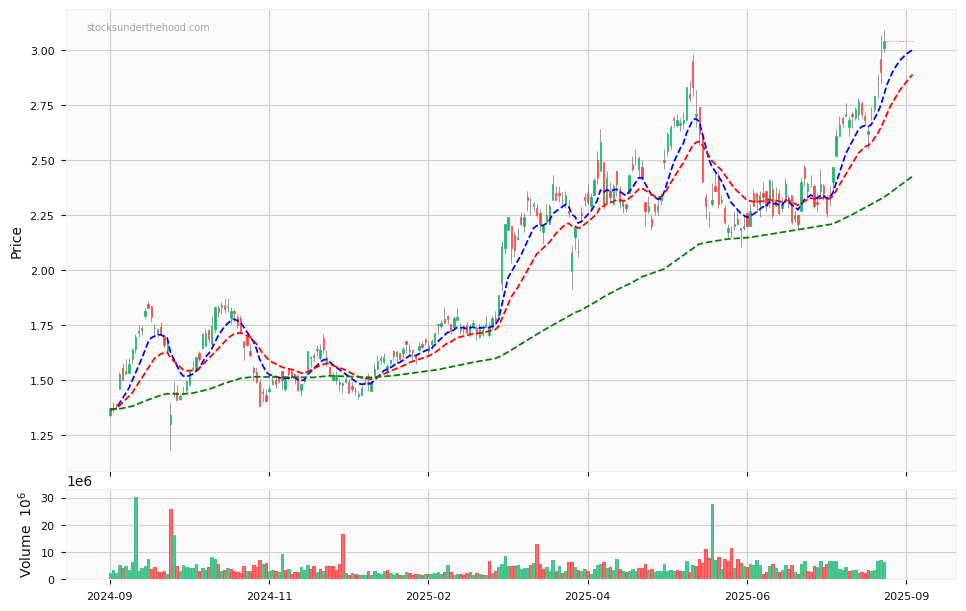
WAF Price Chart with Volume and 3EMA
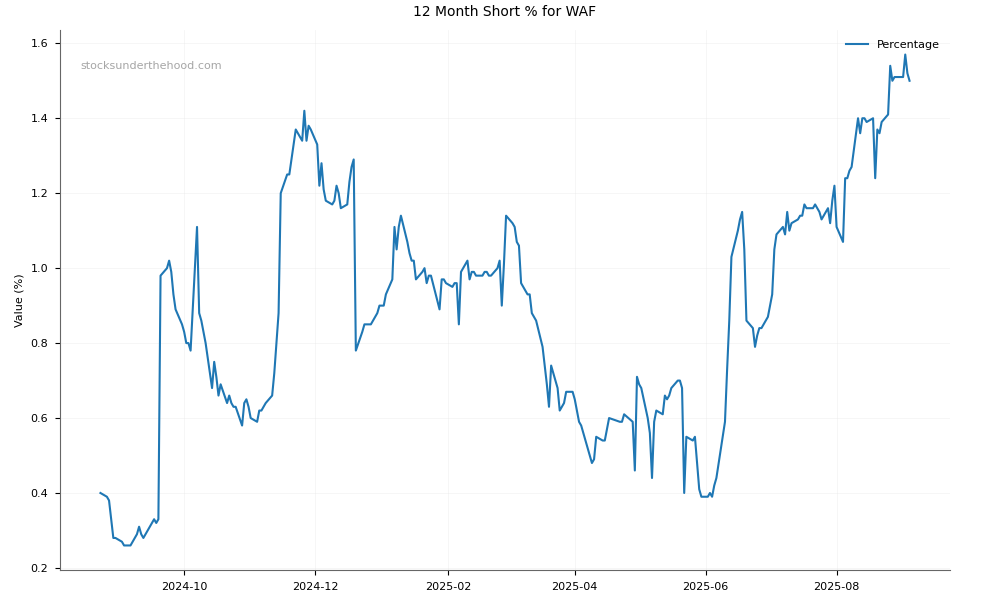
WAF Short Positions
Click HERE to understand why the above moving averages have been chosen.