Xref Limited is a human resources technology company offering an automated reference checking platform, streamlining the recruitment process for organizations worldwide.
Ticker code: XF1
Sector: Technology | Industry: Software – Application | Website: https://www.xref.com
Market Information
| Market Capitalisation | Enterprise Value | Shares Outstanding | Free Float [%] | Free Float Value |
|---|---|---|---|---|
| $35,214,361 | $37,759,737 | 220089764.0 | 39.44 | $13,888,544 |
Balance Sheet & Quality
| Equity | Cash | Debt | Return On Equity (ROE) | EBITDA 25 Margin [%] | Net Debt / Equity [%] | Rule of 40 |
|---|---|---|---|---|---|---|
| -$4,401,795 | $5,287,493 | $7,832,869 | 0.0 | None | -57.8 | None |
Technicals & Short Data
| 3EMA Status | Volatility [%] | Value Traded Today | Average Daily Liquidity | Short [%] | Days To Cover |
|---|---|---|---|---|---|
| Negative | 8.9 | $33,632 | $8,342 | None | 0.0 |
Dividends
| Previous Dividend | Last Dividend | Franking [%] | Ex-Div Date | Gross Yield [%] |
|---|---|---|---|---|
| None | None | None | None | 0.0 |
Price Performance Snapshot
| Last Traded Price | Change [%] | 1 Week [%] | 1 Month [%] | 3 Months [%] | 6 Months [%] | 12 Months [%] |
|---|---|---|---|---|---|---|
| $0.160 | None | None | -5.9 | -5.9 | 6.7 | -24.7 |
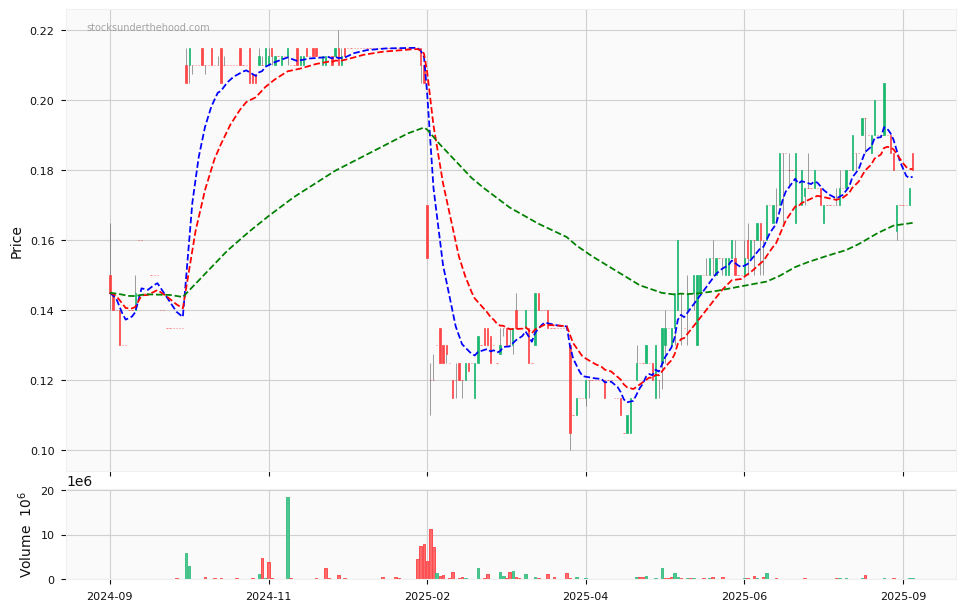
XF1 Price Chart with Volume and 3EMA
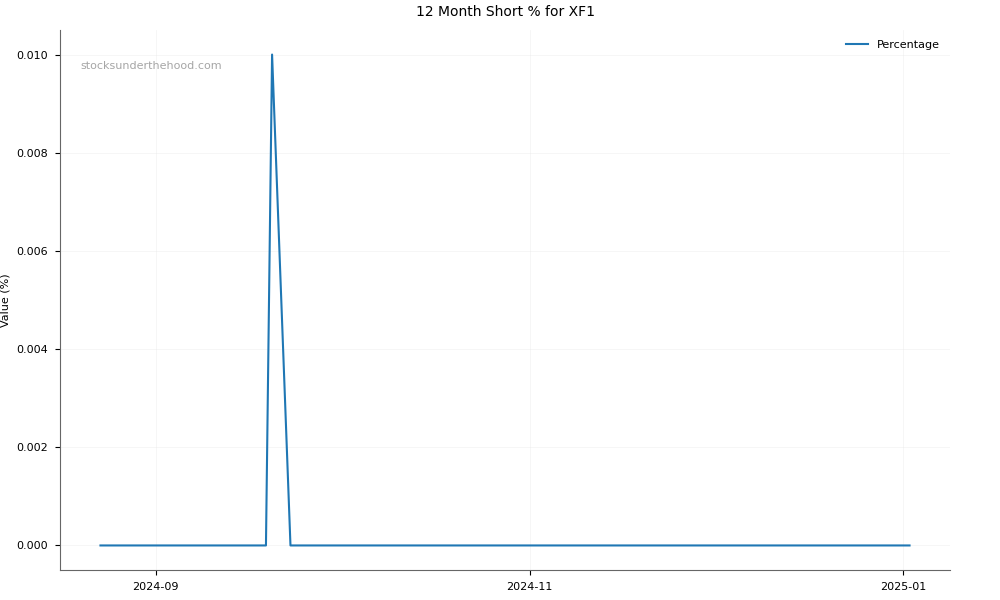
XF1 Short Positions
Click HERE to understand why the above moving averages have been chosen.