IMM Technical Analysis
View This Company’s Fact Sheet: Open | Last updated: December 13, 2025 at 12:39 AM
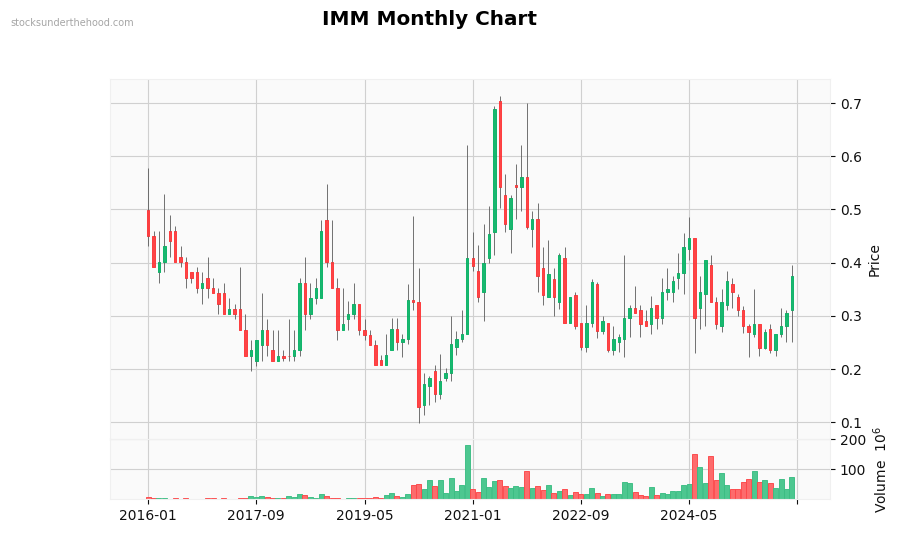
Monthly Observations: Performance: -16.6% (10Y). Volume is significantly above average. with strong buying interest. Recent volume spike detected. Currently in a strong uptrend. Sideways long-term movement (+8.7% over 2 years). High volatility stock. Strong 6-month momentum. Price is in the middle of recent range.
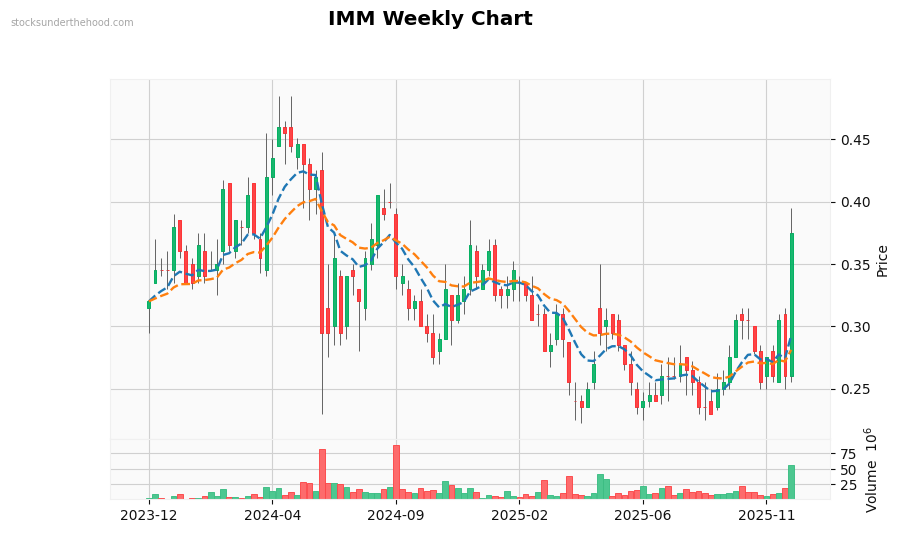
Weekly Observations: Performance: +17.2% (2Y). Volume is above average. Recent volume spike detected. Currently in a strong uptrend. Trading above EMA10. Trading above EMA21. Price is above all EMAs (bullish signal). EMAs are stacked bullishly. Price is at recent highs.
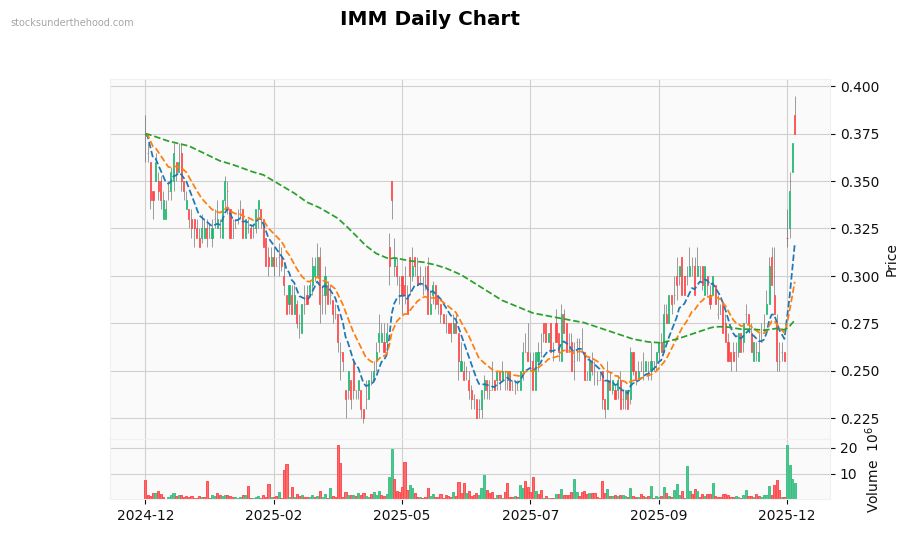
Daily Observations: Performance: 0.0% (1Y). Volume is significantly above average. with strong buying interest. Recent volume spike detected. Currently in a strong uptrend. Trading above EMA10. Trading above EMA21. Trading above EMA125. Price is above all EMAs (bullish signal). EMAs are stacked bullishly. Price is at recent highs.