A trend trading strategy known as the 3EMA Trading Strategy forms the basis for the moving averages employed on the charts in the Fact Sheets section and throughout this website. EMA stands for “Exponential Moving Average”. EMAs provide a way to smooth out price movements and provide us with a trend-line that is a bit more responsive than a standard moving average.
For a list of the current 3EMA Status of nearly 500 companies on the ASX click HERE.
How the 3EMA Trading Strategy Works
- 10-day EMA (fast EMA): This is the most sensitive and shortest-term EMA in this setup, helping to capture recent price movements quickly.
- 21-day EMA (medium EMA): The intermediate EMA acts as a smoother trend indicator and helps confirm the direction that the fast EMA signals.
- 125-day EMA (slow EMA): This long-term EMA provides a baseline trend that represents the broader, more stable direction of the market.
Bullish Signal: A buy signal appears when the 10-day EMA crosses above both the 21-day and 125-day EMAs. This crossover suggests that the shorter-term trend aligns with bullish momentum in the medium and long term.
Bearish Signal: A sell signal occurs when the 10-day EMA crosses below the 21-day and/or 125-day EMAs. The choice of which EMA(s) to follow depends on the trader’s desired risk level for stop-loss.
Confirmation with Volume: Some traders look for increased volume during crossover events as a sign of stronger conviction in the move. This is not essential though.
Some Examples
Megaport ASX:MP1
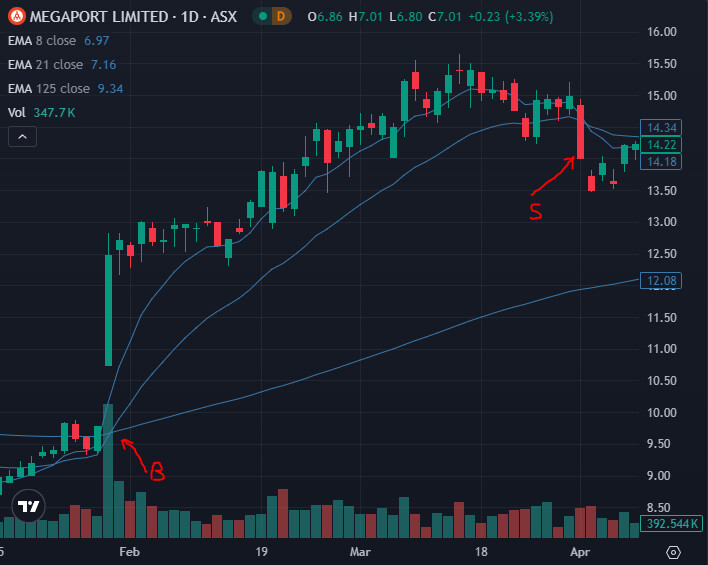
An example of the 3EMA strategy resulting in a profitable trade in Megaport. An entry was taken upon the 10-day EMA crossing the 21 and 125-day EMA’s. This was further supported by an increase in volume and the fact that fundamentally, the company was exhibiting signs of turning around. Those 3 conditions made this a high probability trade. An exit was taken once the 10-day EMA crossed the 21-day EMA. Trades could have been executed on the day of the signal generation for the investor who was on the market at the time and perhaps had been anticipating such a move. Otherwise, entries and exits can be taken the following day, at the opening price.
The 3EMA Change Report provides a list where the moving averages have crossed in the last 3 days from a list of around 500 companies.
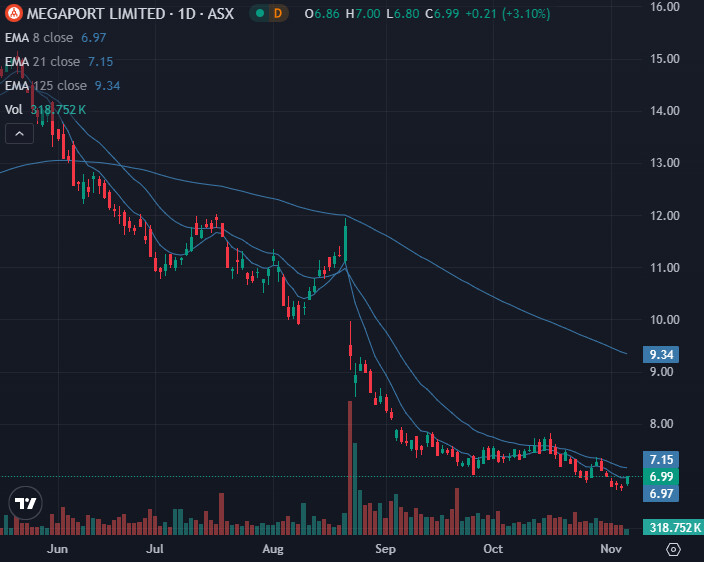
Today the price in MP1 is $6.99. While following this strategy provided a strong profit, it also prevented suffering a large loss. Another advantage of the strategy is that it keeps you out of falling stocks and prevents you from trying to “catch a falling knife”.
Commonwealth Bank ASX:CBA
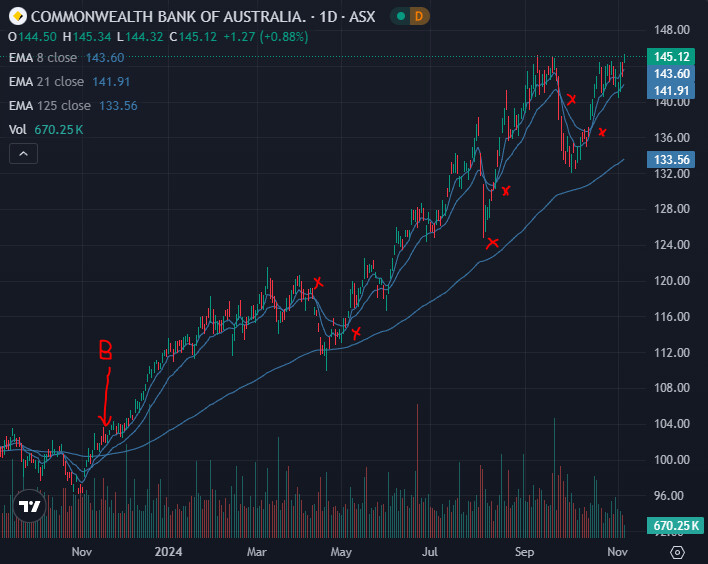
A buy signal was generated using the approach at the end of November 2023 at around $104. Longer-term investors using the 10-day / 21-day / 125-day moving average cross-over sell signal would still be holding that original buy position. The shorter-term trader, would have made 3 closed trades, all of which would have been profitable. They would also be currently in a position in Commonwealth Bank.
Best Applications
The 3EMA crossover strategy works well in trending markets with clear up or down movements. When the 10-day EMA is above the 21-day and 125-day EMAs, it typically signals an established uptrend. The exit signal occurs when the 10-day EMA crosses below the 21-day EMA, capturing profits as the trend begins to reverse. Traders report higher success rates using this approach with assets that trend for longer periods, such as growth stocks or commodities. The 125-day EMA provides a long-term trend threshold, aligning with which often helps capture extended trends.
Limitations
The strategy struggles in choppy or sideways markets, where frequent EMA crossovers result in multiple unprofitable trades and potentially high transaction costs. To avoid this, some traders require a minimum number of closing prices above the 125-day EMA before entering a trade, reducing noise from minor fluctuations.
Disclaimer: This information is provided purely for educational purposes. It takes no account of an individual’s personal financial circumstances and hence can in no way constitute financial advice. The above data may be subject to errors or inconsistencies for which the author takes no liability. It is imperative that all investors do their own research or if they need advice, seek it from a qualified financial adviser.
3EMA Trading Strategy