📅 June, 2025
🌐 Website: https://www.nextdc.com
Here is a forensic financial analysis of NEXTDC Limited (ASX:NXT), based on its FY24 Annual Report, 1H25 Interim Report, and June 2025 Contracted Utilisation Update.
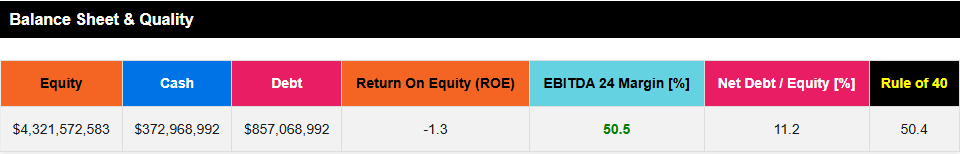
📊 Balance Sheet
| Risk Indicator | Status | Comments |
|---|---|---|
| Goodwill >25% of Assets | ✅ | NEXTDC has minimal to no goodwill on its balance sheet; most assets are tangible infrastructure. |
| Rising Receivables Days | ✅ | Receivables are proportionate to revenue, no material stretch identified. |
| Inventory Growth vs Profit | Not Applicable | NEXTDC operates infrastructure-based services with immaterial inventory; capital is invested in property and equipment, not working capital. |
| High Borrowings | 🔴 | Debt facilities expanded to $2.9B in Dec 2024; leverage rising to fund major infrastructure rollout. |
| Loans to Related Parties | ✅ | No such loans identified in FY24 or 1H25 reports. |
| Idle Cash | 🟠 | ~$1.2B in cash as at June 2024; while allocated to growth, specific return metrics or deployment timelines are not fully detailed. |
📈 Income Statement
| Risk Indicator | Status | Comments |
|---|---|---|
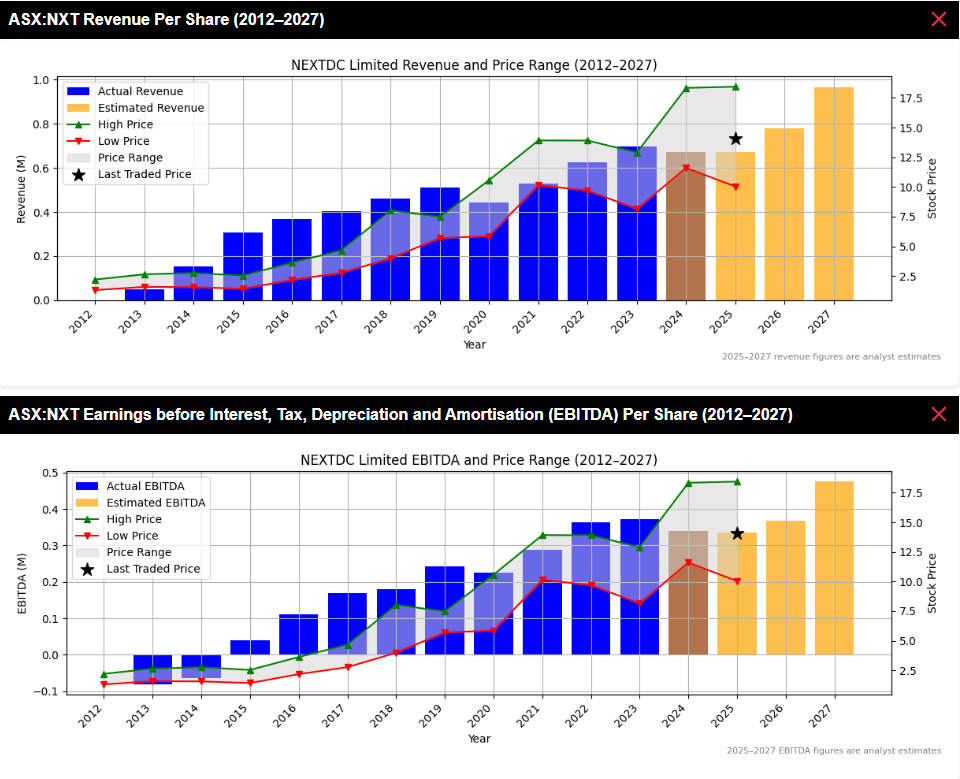
| Revenue vs Profit Divergence | 🔴 | Revenue declined 2% in 1H25 vs pcp, while net loss doubled to $42.7M. |
| Capitalised R&D/Interest | ✅ | Capitalised costs are infrastructure-related; no aggressive accounting detected. |
| Extraordinary Items | 🟠 | Debt refinance in 1H25 triggered $26.5M in write-offs; one-off but material. |
| Tax Rate Drop | ✅ | No unusual tax treatment; losses explain low tax. |
| Profit vs Cash Flow | ✅ | Operating cash flow aligned reasonably with net results considering depreciation-heavy model. |
| One-Off Gains Boosting Profit | ✅ | No evidence of non-operating gains inflating earnings. |
🏛️ Governance, Disclosure & Audit
| Risk Indicator | Status | Comments |
|---|---|---|
| Auditor Changes | ✅ | No change or concern noted. |
| Audit Qualifications | ✅ | Clean audit opinions. |
| Exec Departures | ✅ | Executive team has remained stable through major expansion. |
| Transparency Issues | ✅ | Clear and detailed reporting; strong disclosure on ESG and strategy. |
| Board Weakness | ✅ | Board is independent and experienced. |
| Executive Pay Misalignment | ✅ | Incentives linked to long-term metrics; no red flags. |
| Promotional Language | 🟠 | Narrative around “AI revolution”, “industrial era”, and “sovereign infrastructure” leans promotional despite ongoing losses. |
🧠 Strategic Risk Factors
| Risk Indicator | Status | Comments |
|---|---|---|
| Chronic Unprofitability | 🔴 | Multiple years of net losses, with 1H25 loss deepening due to financing structure. |
| Revenue < Capex | 🔴 | Capex consistently exceeds revenue; ~$1B spent in 1H25 alone. |
| Funding Dependency | 🔴 | $1.3B equity raised in FY24; further reliance on $2.9B debt deal confirms dependency. |
| Customer Concentration | ✅ | Broad customer base; no undue concentration. |
| Pre-commercial Product Risk | ✅ | Core platform is operational; KL1 is in development but part of a broader commercialised network. |
| Short Cash Runway | ✅ | Over $2.5B in liquidity (cash + undrawn debt) as at Dec 2024. |
| Regulatory/Compliance Exposure | ✅ | Strong ESG, ISO and compliance footprint. No active breaches noted. |
| Leadership Turnover During Expansion | ✅ | CEO and board consistent through multi-region rollout. |
✅ Final Summary
| Category | 🔴 Red Flags | 🟠 Amber Flags |
|---|---|---|
| Balance Sheet | 1 | 1 |
| Income Statement | 2 | 1 |
| Governance / Disclosure | 0 | 1 |
| Strategic Risk Factors | 3 | 0 |
🔴 Total Red Flags: 6
🟠 Total Amber Flags: 3
🟠 Amber & 🔴 Red Flag Overview
-
🔴 High Borrowings: Significant expansion of debt facilities in late 2024 increases leverage risk.
-
🔴 Revenue vs Profit Divergence: Net losses widened despite stable revenue due to non-operating items.
-
🔴 Chronic Unprofitability: Losses persist multiple years with no clear path to net profitability.
-
🔴 Revenue < Capex: Capex outpaces revenue by a large margin, driven by international build-outs.
-
🔴 Funding Dependency: Equity raise and new debt package confirm reliance on external funding.
-
🟠 Idle Cash: Significant cash on balance sheet with limited clarity on ROI deployment plan.
-
🟠 Extraordinary Items: Material refinancing costs in 1H25 skewed profitability.
-
🟠 Promotional Language: Heavy emphasis on AI positioning may overstate near-term fundamentals.
Disclaimer: This information is provided purely for educational purposes. It takes no account of an individual’s personal financial circumstances and hence can in no way constitute financial advice. The above data may be subject to errors or inconsistencies for which the author takes no liability. It is imperative that all investors do their own research or if they need advice, seek it from a qualified financial adviser.
Forensic Analysis: NextDC ASX:NXT