Pro Medicus Limited – 2025 Interim Results Summary
Overall Tone
Pro Medicus Limited (PME) has delivered exceptional financial results for the half-year ended 31 December 2024, reflecting strong revenue growth, margin expansion, and increasing profitability. The company’s North American expansion and contract wins have significantly contributed to this above-market performance, alongside disciplined cost management and robust cash flow generation.
Key Financial Metrics
| Metric | H1 FY25 (31 Dec 2024) | H1 FY24 (31 Dec 2023) | Change (%) |
|---|---|---|---|
| Revenue ($’000) | 97,190 | 74,110 | +31.1% |
| EBITDA ($’000) | N/A | N/A | |
| EBT ($’000) | 73,272 | 50,162 | +46.1% |
| NPAT ($’000) | 51,745 | 36,250 | +42.7% |
| Operating Cash Flow ($’000) | 48,710 | 28,988 | +68.1% |
| Net Cash & Financial Assets ($’000) | 182,330 | 154,900 | +17.7% |
| Interim Dividend (cents per share) | 25.0 | 18.0 | +38.9% |
Performance Analysis
Revenue Growth
- Revenue surged 31.1% to $97.2 million, driven by strong growth in North America (+34.6%), contract renewals, and increasing adoption of PME’s software solutions.
- On a constant currency basis, revenue would have been $97.84 million (+32.0%).
- Growth in Europe (+0.8%) and Australia (+10.8%) was modest but steady.
EBT & NPAT
- Earnings before tax (EBT) rose 46.1% to $73.27 million, reflecting strong operating leverage.
- Net profit after tax (NPAT) increased by 42.7% to $51.75 million, demonstrating margin expansion and cost efficiencies.
Cash Flow & Balance Sheet Strength
- Operating cash flow surged 68.1% to $48.71 million, highlighting PME’s strong cash generation ability.
- Cash reserves increased by $24.48 million, despite higher dividend payouts.
- PME remains debt-free, positioning it well for future expansion and strategic investments.
Dividend Increase
- Interim dividend raised to 25.0 cents per share (vs. 18.0 cents in H1 FY24), representing a 38.9% increase.
- Reflects management confidence in PME’s earnings growth and commitment to shareholder returns.
Outlook Commentary
- PME is well-positioned for continued growth, particularly in North America, where it secured $365 million in new contracts across Lurie Children’s Hospital, Trinity Health, and Duly Health & Care.
- Contract renewals with NYU Langone, Duke Health ($39 million, 5-year deals), and Mercy Health ($98 million, 8-year deal) provide a long-term revenue base.
- Investment in AI-driven imaging solutions and R&D continues to support PME’s competitive edge.
- The company remains focused on academic hospitals, integrated delivery networks (IDNs), and corporate imaging centers, expanding its global footprint.
Guidance Statements
- No formal guidance was provided, but the growth trajectory remains strong.
- The company’s cash reserves and contract backlog suggest continued revenue expansion.
Market Expectation vs. Actual Performance
- Given the strong revenue growth, margin expansion, and contract pipeline, PME’s results likely exceeded market expectations.
- North American contract wins and strong cash flow generation are major positives.
- The 38.9% increase in dividend payout signals management confidence.
- The market may react positively, given PME’s high-growth profile, expanding margins, and cash generation strength.
Per Share Analysis
| Metric | H1 FY25 | H1 FY24 | Change (%) |
|---|---|---|---|
| Earnings per Share (EPS) | 49.53 cents | 34.71 cents | +42.7% |
| Diluted EPS | 49.44 cents | 34.61 cents | +42.9% |
| Interim Dividend per Share | 25.0 cents | 18.0 cents | +38.9% |
Conclusion
Pro Medicus Limited delivered outstanding H1 FY25 results, with exceptional revenue growth (+31.1%), profit expansion (+42.7%), and cash flow strength (+68.1%). The strong contract wins, high-margin business model, and disciplined capital allocation position PME for continued outperformance. The increase in dividend payout (+38.9%) further reinforces management’s confidence in sustained growth.
PME’s results likely exceeded market expectations, and the stock may react positively given its strong fundamentals, debt-free balance sheet, and strategic expansion plans.
Disclaimer: This information is provided purely for educational purposes. It takes no account of an individual’s personal financial circumstances and hence can in no way constitute financial advice. The above data may be subject to errors or inconsistencies for which the author takes no liability. It is imperative that all investors do their own research or if they need advice, seek it from a qualified financial adviser.
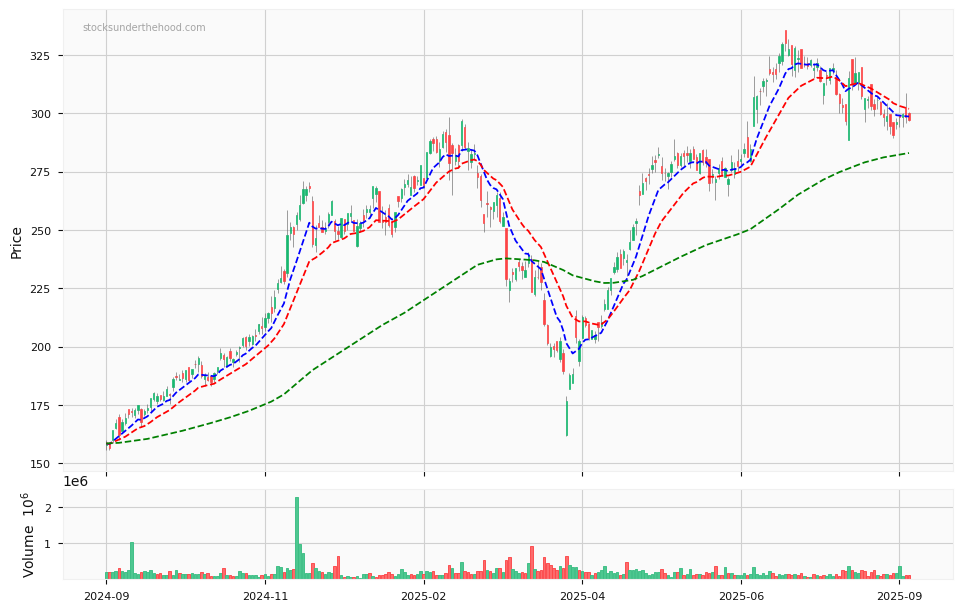
Quick Take: H1FY25 ASX:PME