Qantas Airways Limited is Australia’s largest domestic and international airline, providing passenger and freight services, operating regional, domestic, and international flights, and offering loyalty programs.
Ticker code: ASX:QAN
Sector: Industrials | Industry: Airlines | Website: https://www.qantas.com
Market Information
| Market Capitalisation | Enterprise Value | Shares Outstanding | Free Float [%] | Free Float Value |
|---|---|---|---|---|
| $17,931,420,577 | $23,535,800,320 | 1513200000 | 98.91 | $17,735,858,836 |
Balance Sheet & Quality
| Equity | Cash | Debt | Return On Equity (ROE) | EBITDA 24 Margin [%] | Net Debt / Equity [%] | Rule of 40 |
|---|---|---|---|---|---|---|
| $779,297,982 | $2,212,999,936 | $7,955,999,744 | 475.8 | 18.5 | 736.9 | 31.8 |
Technicals & Short Data
| 3EMA Status | Volatility [%] | Value Traded Today | Average Daily Liquidity | Short [%] | Days To Cover |
|---|---|---|---|---|---|
| Positive | 3.3 | $44,713,749 | $56,510,460 | 0.09 | 0.3 |
Dividends
| Previous Dividend | Last Dividend | Franking [%] | Ex-Div Date | Gross Yield [%] |
|---|---|---|---|---|
| $0.130 | $0.165 | 100.0 | 2025-03-11 | 3.6 |
Price Performance Snapshot
| Last Traded Price | Change [%] | 1 Week [%] | 1 Month [%] | 3 Months [%] | 6 Months [%] | 12 Months [%] |
|---|---|---|---|---|---|---|
| $11.850 | 0.6 | 2.1 | 8.7 | 10.5 | 31.2 | 74.2 |
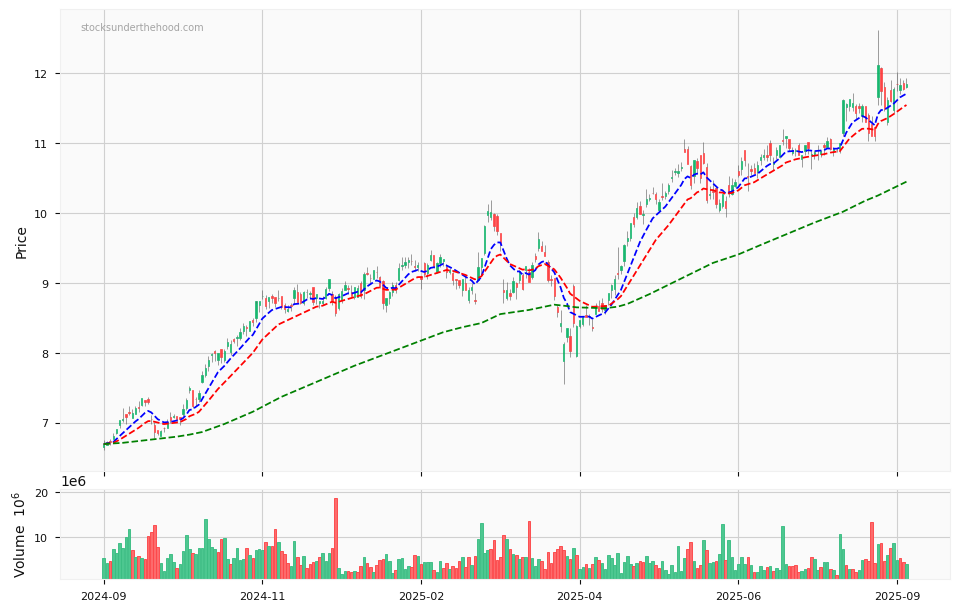
ASX:QAN Price Chart with Volume and 3EMA
ASX:QAN Short Positions

Click HERE to understand why the above moving averages have been chosen.