This is a restricted members post.
Author: Nathan
RPMGlobal Holdings (ASX:RUL) Analysis
This is a restricted members post.
MMA Offshore (ASX:MRM) Analysis
This is a restricted members post.
Micron Technology (NASDAQ:MU) Analysis
This is a restricted members post.
Amazon (NASDAQ:AMZN) Analysis
This is a restricted members post.
18/3/24 Monday Charts
Let’s have a look at some charts to give us some idea of the state of markets.
10 Year Bond Yield chart
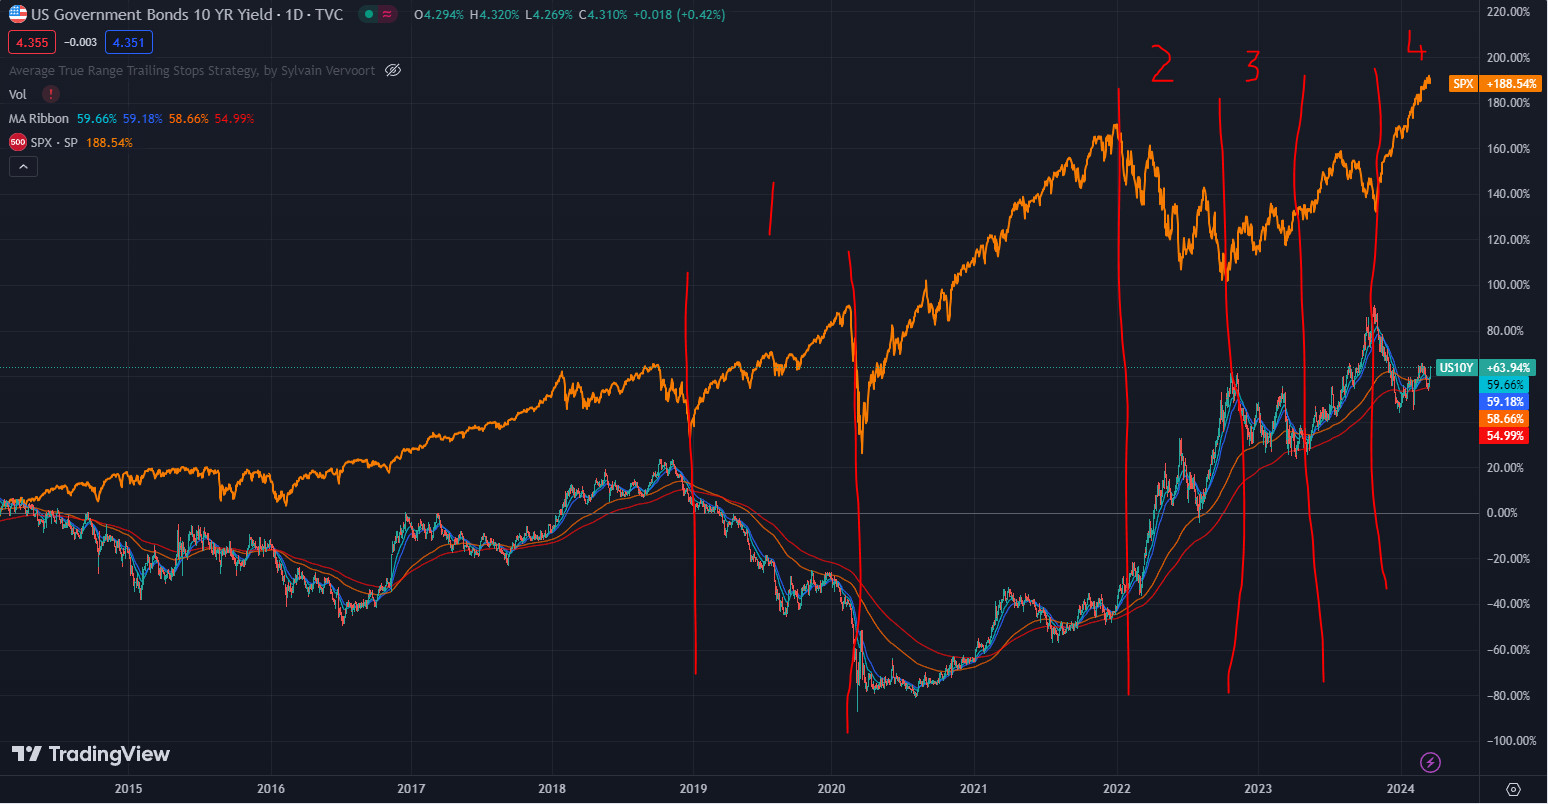
source: tradingview.com
The 10 year Bond yield and the S&P500 by no means have a perfect inverse correlation. However, at certain times, the 10Y has been the strongest influence on the stock market. I have highlighted 4 such times above. We currently sit at a very interesting point. The markets exploded at the end of last-year when it was thought that bond yields had peaked. However, recent data in the US suggests the fall in inflation isn’t going to be in straight-line – at least from now on as the world tries to remove the last 1-2%. On all measures on the chart above, Bond yields are in an uptrend. Yet so is the S&P 500. This can’t remain so forever. At some point the market has to fall or bond yields have to fall.
Crude Oil chart
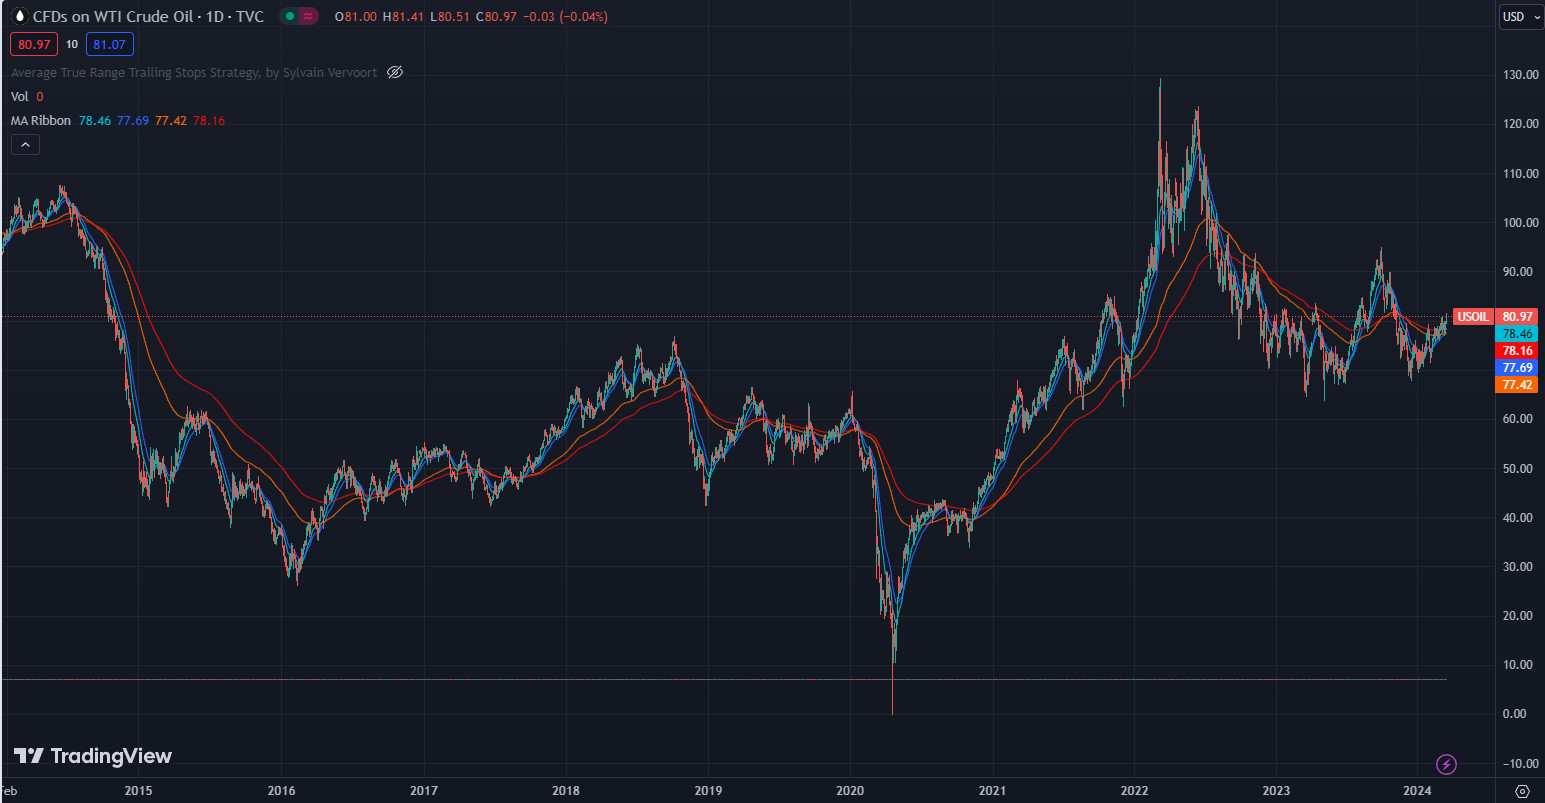
source: tradingview.com
One of the major inputs to inflation is oil. For all of this year, the oil price has been slowly but surely rising. If it continues it will be difficult for inflation to fall and hence bond yields will keep marching higher.
Iron Ore chart
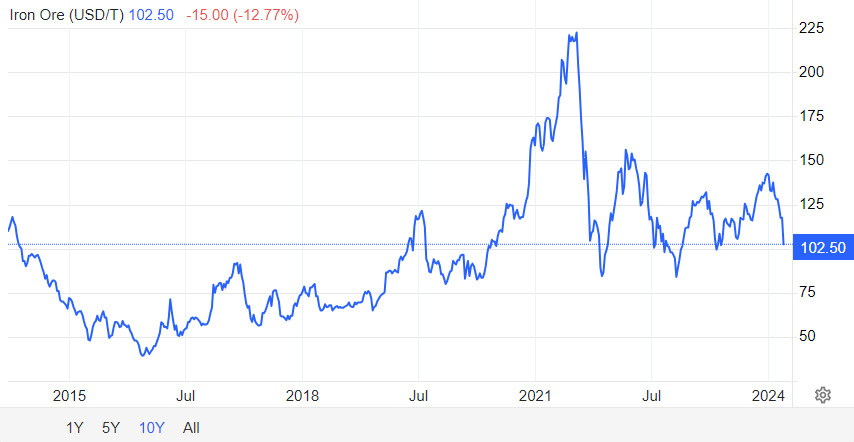
source: tradingeconomics.com
For Australia, iron ore is a crucial commodity. We hold 30% of the planet’s resources of iron ore and lead the world in its production. In 2021-2022 iron ore contributed $133B in export earnings. This long-term chart doesn’t really tell the story of what’s happening at the moment. The Iron ore price falling very quickly from over $140USD/T to $100 will hurt BHP, FMG and RIO which in turn hurts the overall Australian market indices and of course the Australian economy.
Uranium chart
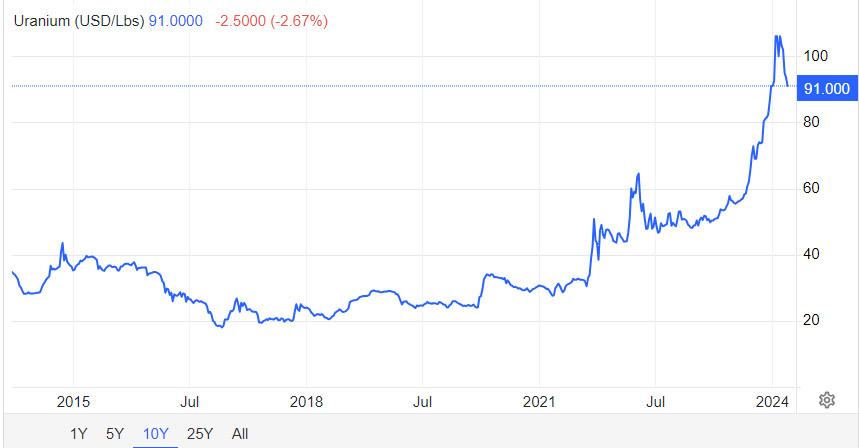
source: tradingeconomics.com
The parabolic rise in the Uranium price continues to unwind.
Copper chart
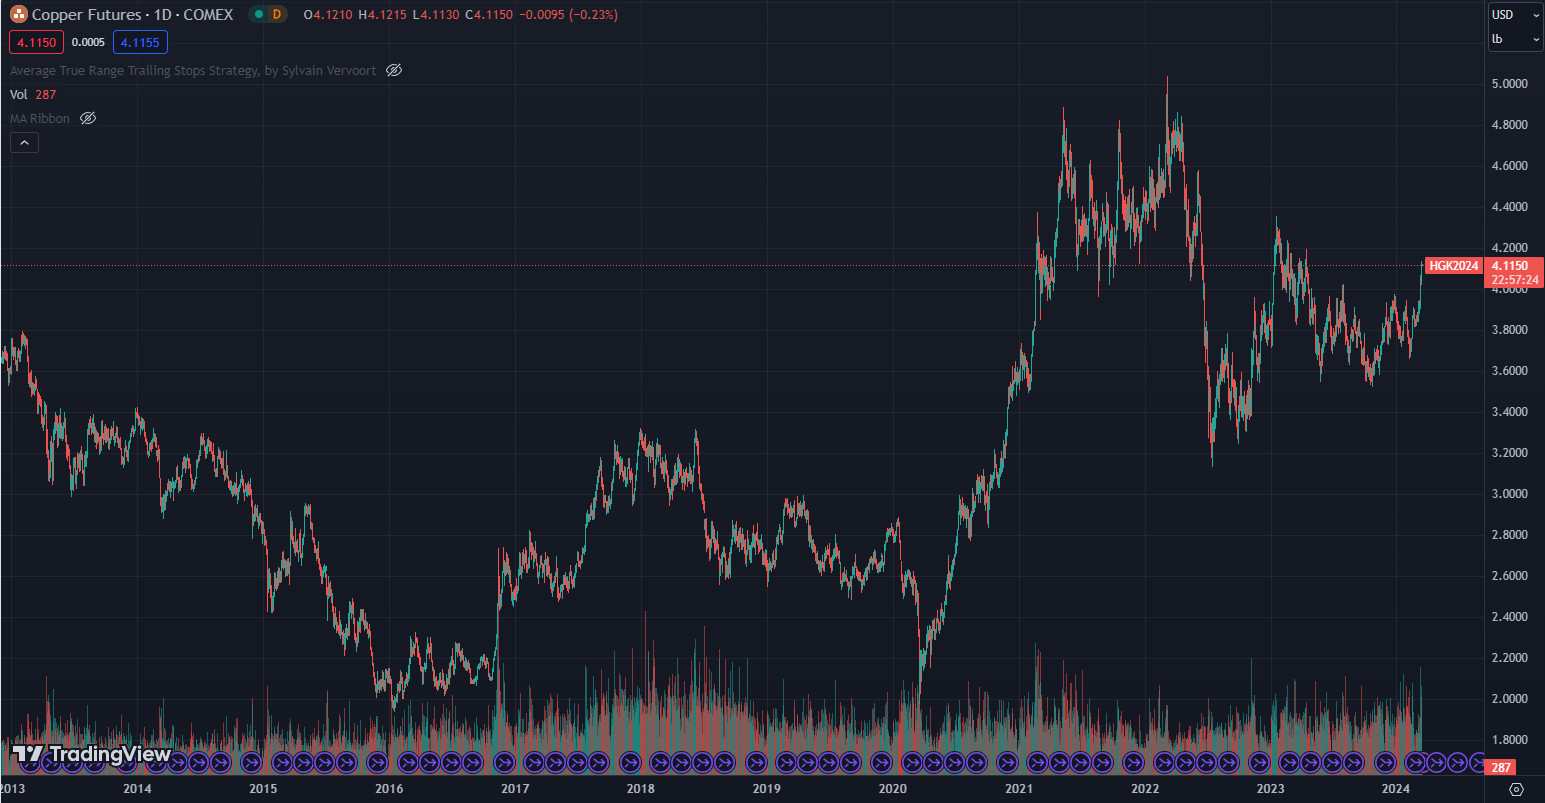
source: tradingview.com
Boring old copper seemed to wake up last week. Sadly there aren’t really any quality stocks on the ASX to play the copper theme. Making up 25% of their EBITDA, at least it helps soften the blow of the iron ore price drop for BHP. Sandfire (ASX:SFR) is the biggest but has been an inconsistent performer for a long time. Nevertheless, it has responded to the latest copper move.
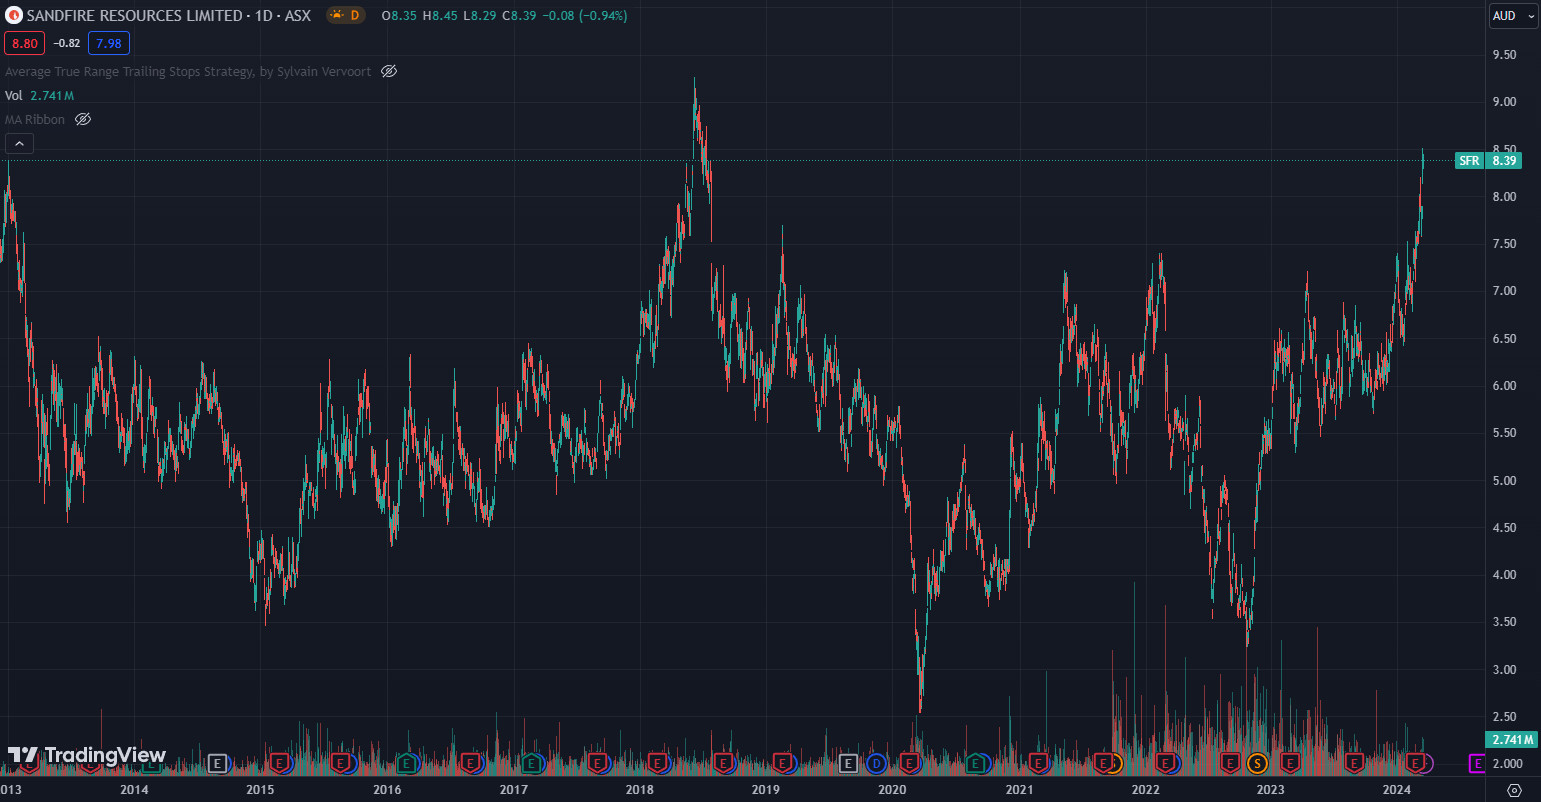
source: tradingview.com
Lithium chart
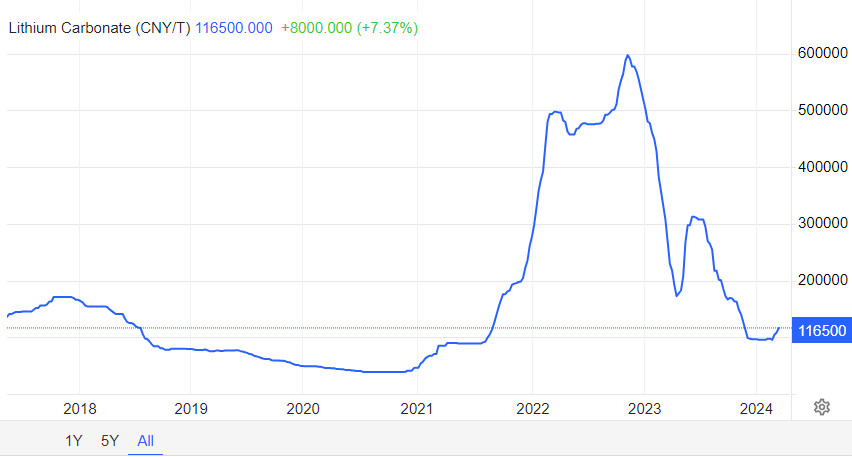
source: tradingeconomics.com
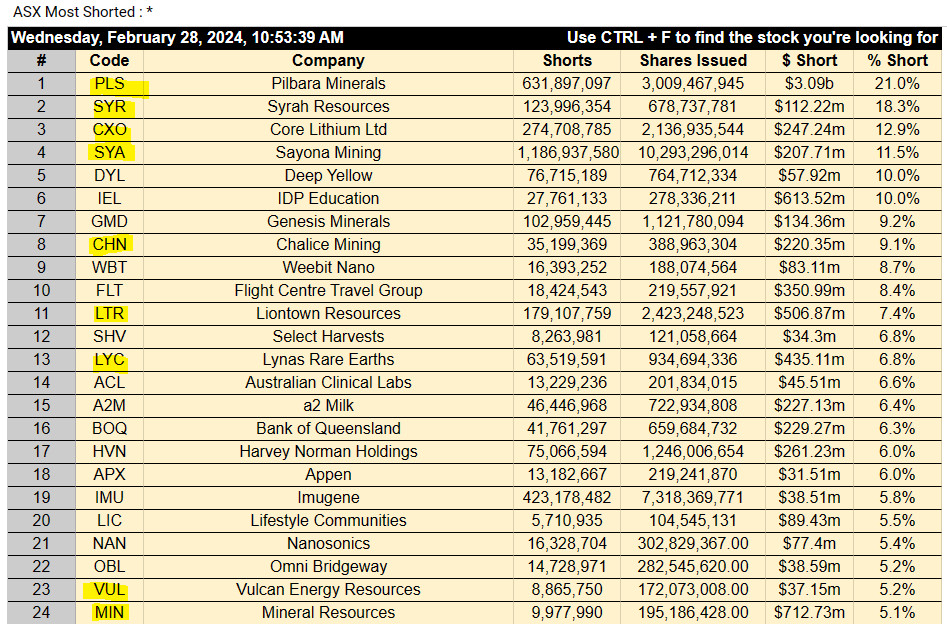
The tiniest signs of life in Lithium has seen some strong moves in the Lithium stocks of late. Many have large short positions so any further moves up in the Lithium price should see outsized gains in the stocks.
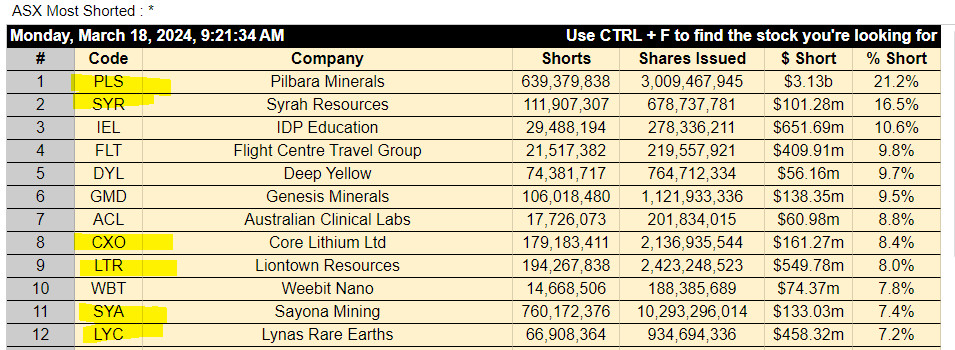
source: https://stocksunderthehood.com/asx-most-shorted-stocks/
Not all of the stocks are highlighted are lithium stocks but all of them are tied to sentiment around the lithium price.
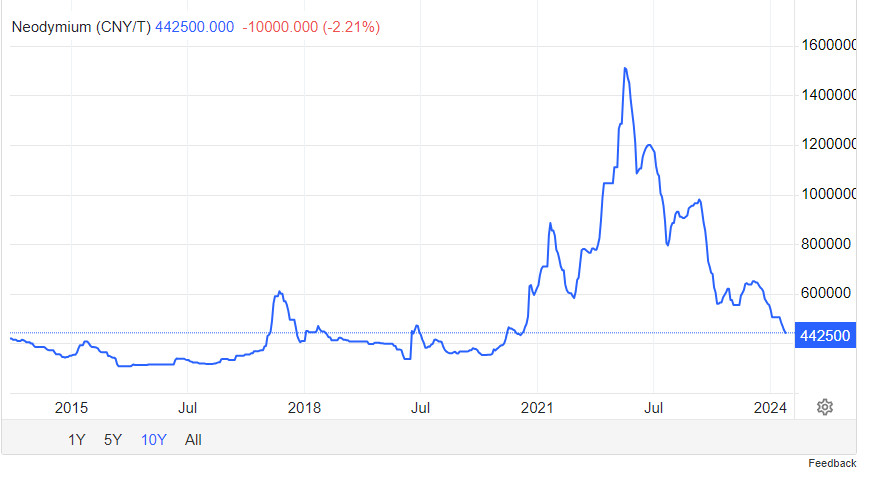
source: tradingeconomics.com
Although this is the Neodymium price. There is no sign of improved sentiment here yet. Neodymium is a rare earth and the major source of income for Lynas (ASX:LYC) – #12 on the short list above.
Disclaimer: This information is provided purely for educational purposes. It takes no account of an individual’s personal financial circumstances and hence can in no way constitute financial advice. The above data may be subject to errors or inconsistencies for which the author takes no liability. It is imperative that all investors do their own research or if they need advice, seek it from a qualified financial adviser.
Audinate Group (ASX:AD8) Analysis
This is a restricted members post.
JoinUpstart Holdings (NASDAQ:UPST) Analysis
This is a restricted members post.
Snowflake (NYSE:SNOW) Analysis
This is a restricted members post.
Mount Gibson Iron (ASX:MGX) Analysis
This is a restricted members post.
JoinGROWTH Model Update 3
This is a restricted members post.
JoinSome Charts – Fri Mar 8, 2024
Some charts have really taken off this week. Let’s have a look at a few.
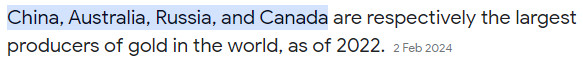
Gold
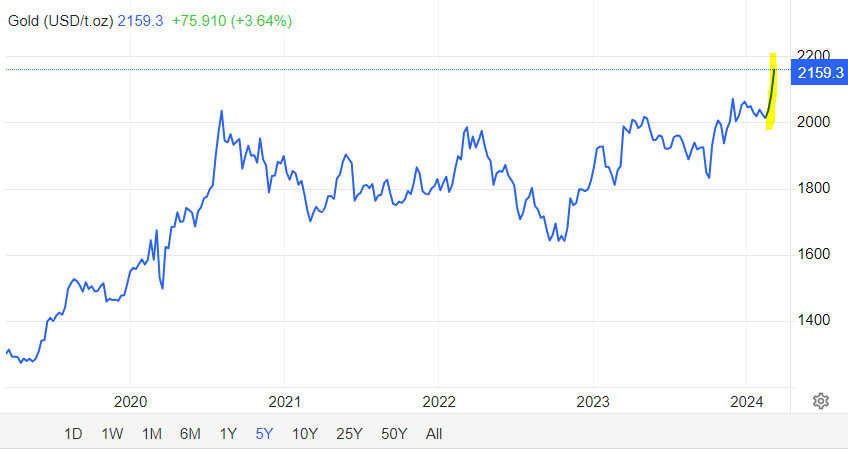
The long term trend for gold remains up. Medium term it had been going sideways for a number of years. This week it has broken higher potentially signally the start of a new medium-term uptrend.
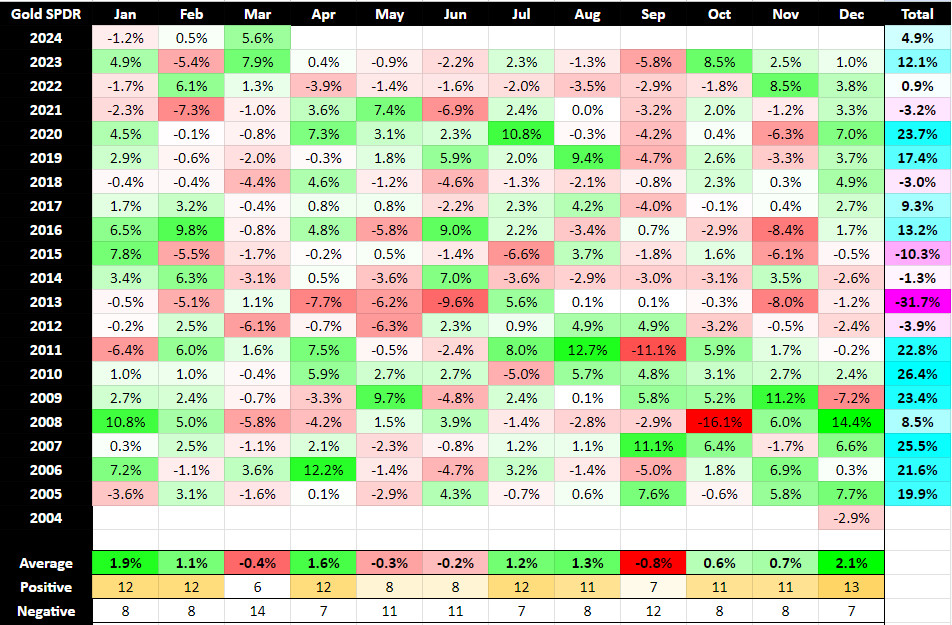
source: https://stocksunderthehood.com/free-resources/gold-seasonality/
Interestingly March was a strong month for gold last year too in what has historically been a poor month for gold. Gold had a great year last year triggered by the fall in bond yields and subsequent fall in the $USD. Wars and uncertainty also tend to help gold.
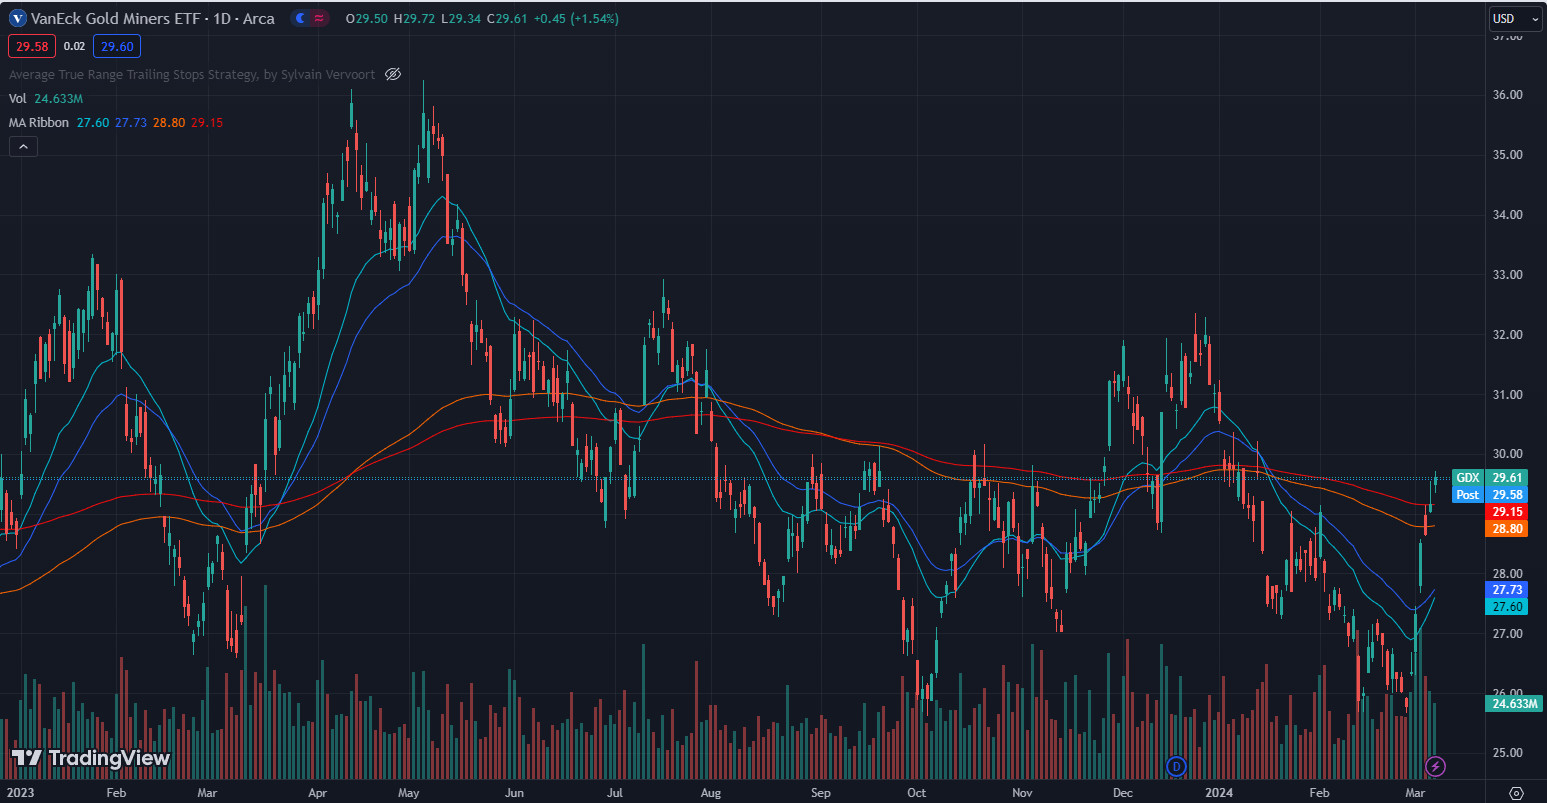
The gold miners ETF completely underperformed the move in physical gold from December 2023 until the start of this month. In the last 5 sessions, it has reversed its trend and is now potentially playing a bit of catch-up.
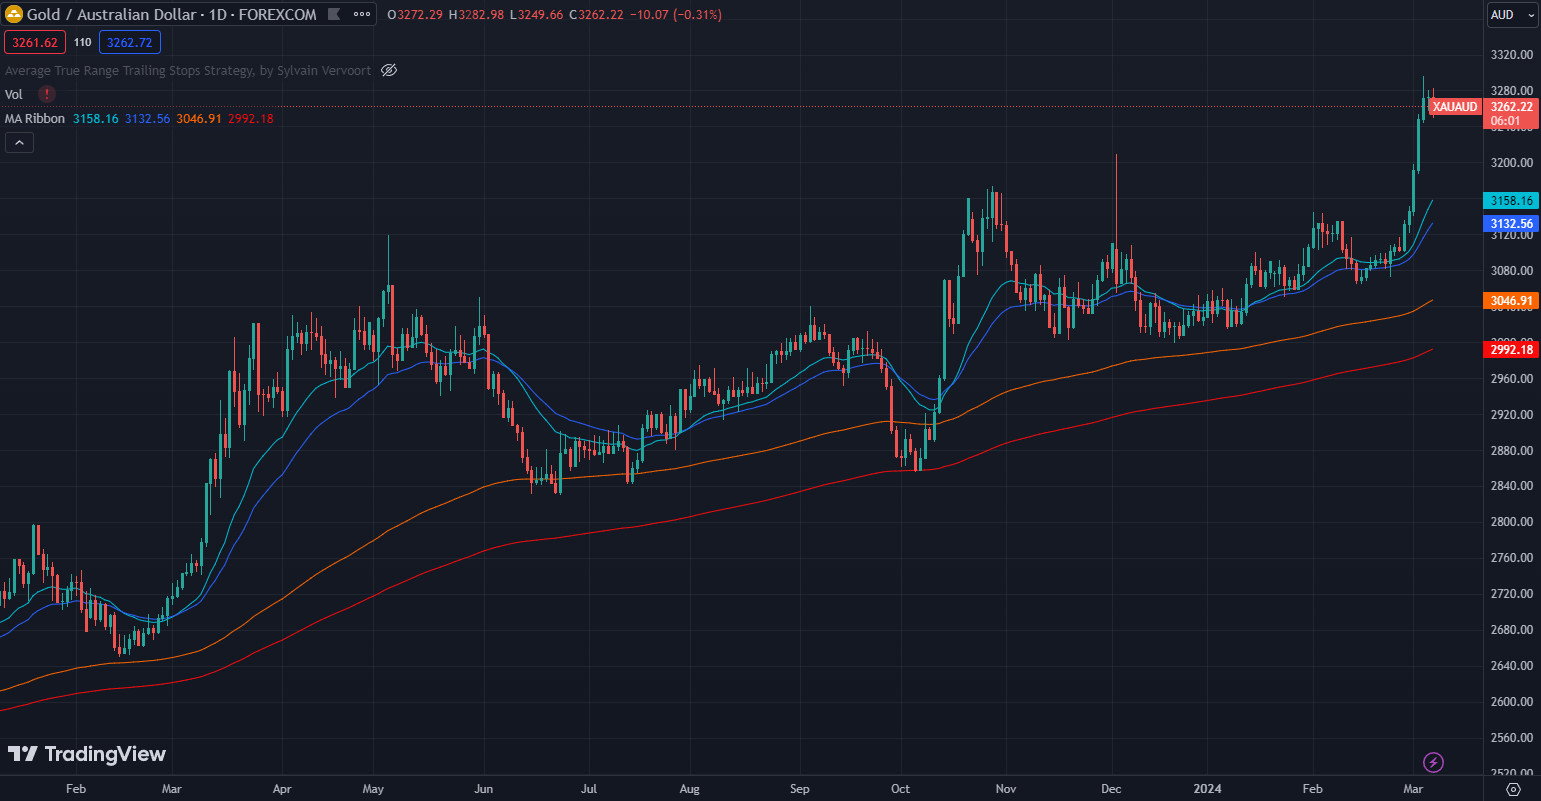
Most importantly for Australian gold miners is the gold price in Australian dollars and it’s the best chart of all.
Crude Oil
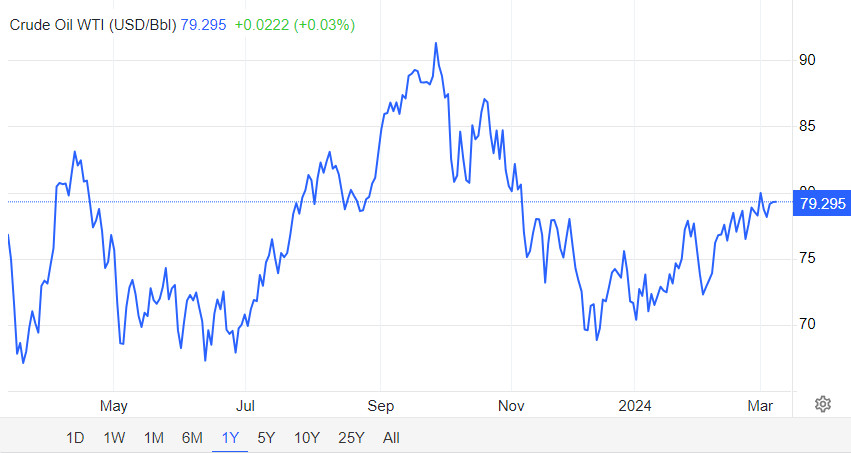
Slowly but surely the oil price continues to march higher. Markets are enjoying an idyllic time where inflation is falling, interest rates are projected to fall and the US$ is falling. A rising oil price has the potential to derail that and should always be monitored.
Iron Ore
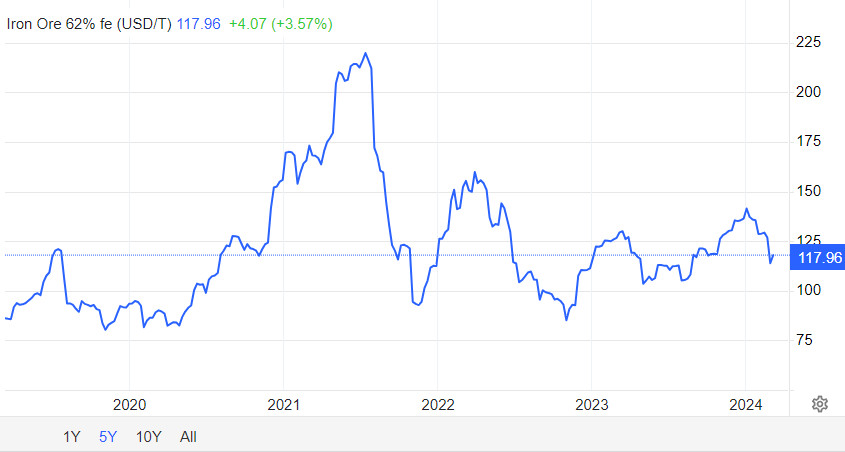
Probably the most important commodity for Australia (along with Oil) is Iron Ore. The price has fallen quite a lot since the start of the year. It’s impressive that our market is at all time highs when you think about the weighting the iron ore price has in our index.
Uranium
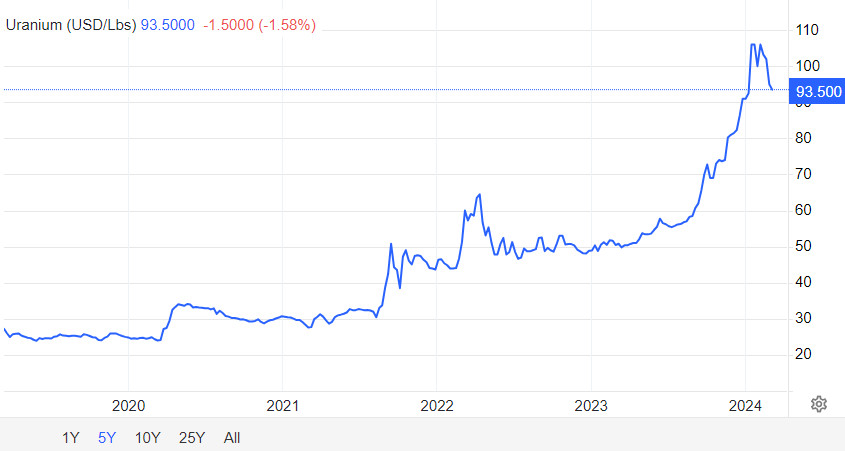
The Uranium price is taking a breather from its parabolic rise. The Uranium miners have also. Nevertheless, if the price can remain somewhere around these levels for the medium term, the producers are certain to be highly profitable. There is a chance though that Uranium does what the other hot commodities of recent times (Lithium. Nickel, Coal) and continues to fall from here. Never underestimate the efficiency of markets. If there is a spike in demand like there no doubt is and will be in Uranium, you can expect a swift response from the market to meet that demand. With a uranium price hovering near $100, the incentives are immense.
Bitcoin
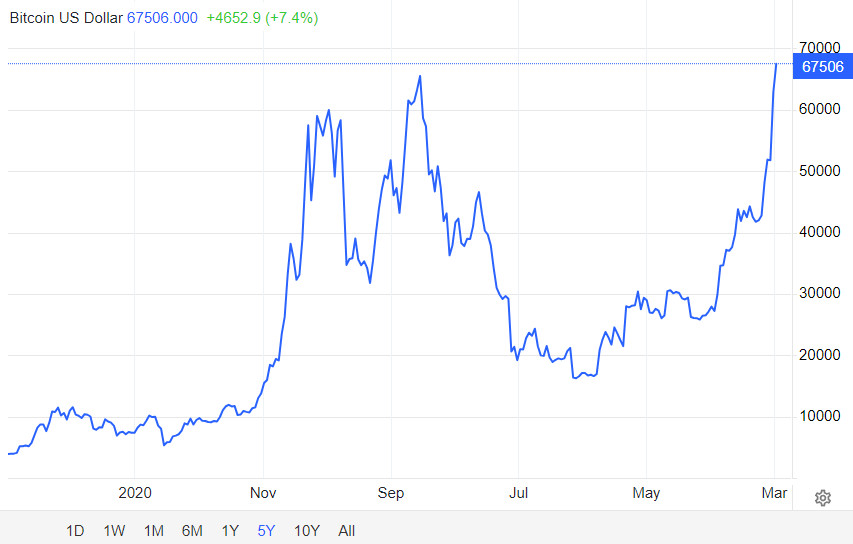
Bitcoin continues to be a traders dream. Who knows if it will be legitimised as something of use in the future. The fact is, there have been some significant tailwinds for Bitcoin. Some of those are the same as those that gold is currently experiencing, while the approval of the Bitcoin ETF and the upcoming halving are all reasons to create demand. Ironically, I think the biggest thing that works against bitcoin becoming a legitimate form of payment is the fact it keeps appreciating. If you owned bitcoin, would you want to spend it? If you don’t want to spend it and use it as a form of currency then what is it?
The day ahead
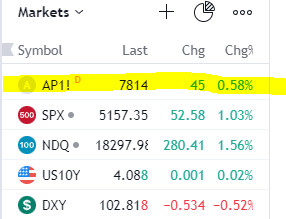
Our market is set to have another good day. Our futures are pointing to a 45 point rise at the open. The US had a great night, while bond yields were flat and the $USD continued to fall.
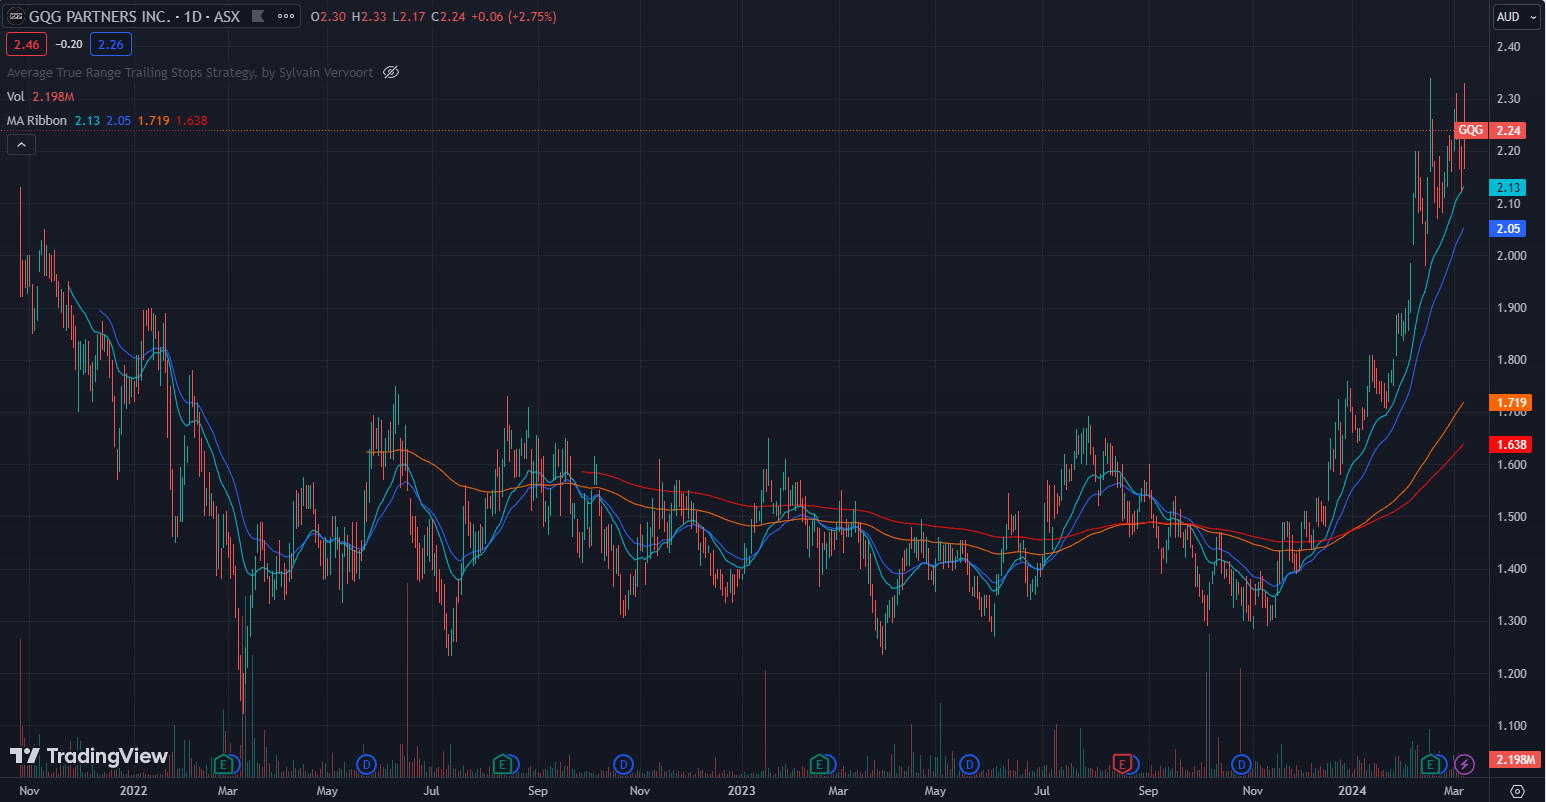
GQG Partners (ASX:GQG)
https://gqg.com/
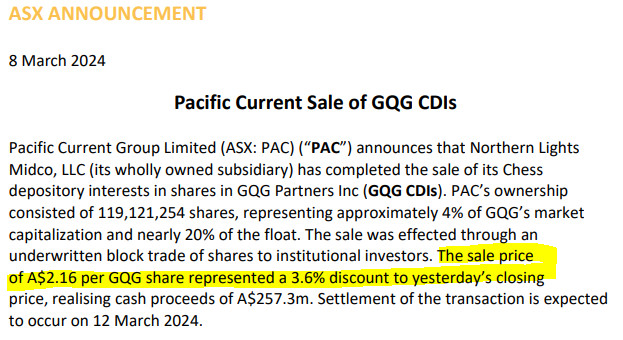
GQG Partners (ASX:GQG) has been going very well of late. Any fall in the share price as a result of this may be temporary and an opportunity for those that have been wanting to get on board to do so.
Disclaimer: This information is provided purely for educational purposes. It takes no account of an individual’s personal financial circumstances and hence can in no way constitute financial advice. The above data may be subject to errors or inconsistencies for which the author takes no liability. It is imperative that all investors do their own research or if they need advice, seek it from a qualified financial adviser.
A look at Insider Selling
This is a restricted members post.
JoinAmplitude Energy ASX:AEL Analysis
This is a restricted members post.
Polynovo (ASX:PNV) Analysis
This is a restricted members post.
JoinCoupang (NYSE:CPNG) Analysis
This is a restricted members post.
GROWTH Model Update 2
This is a restricted members post.
JoinBHP (ASX:BHP) Analysis
This is a restricted members post.
Thursday 29/2/24
Last day of ASX earnings season, let’s see what the market has in store for us today. A look at ASX:MDR, ASX:MOZ and ASX:MVP.
Updated 9:45am
BEFORE THE MARKET OPEN
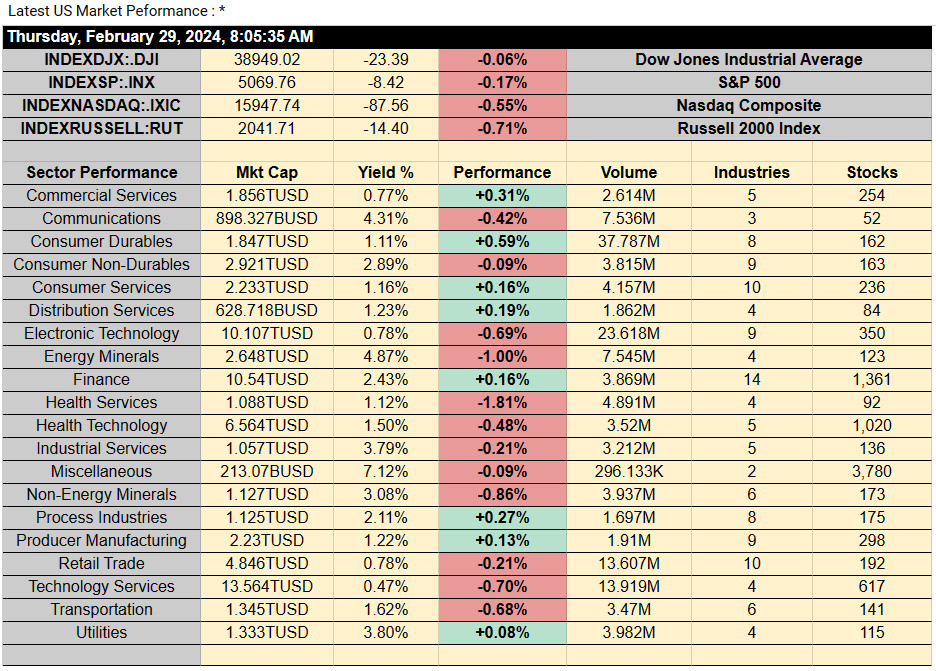
Source: https://stocksunderthehood.com/free-resources/us-sector-performance/
Most sectors saw falls overnight in the US. Our market is projected to open down 15 points.
The following chart is an ETF of global gold mining companies.
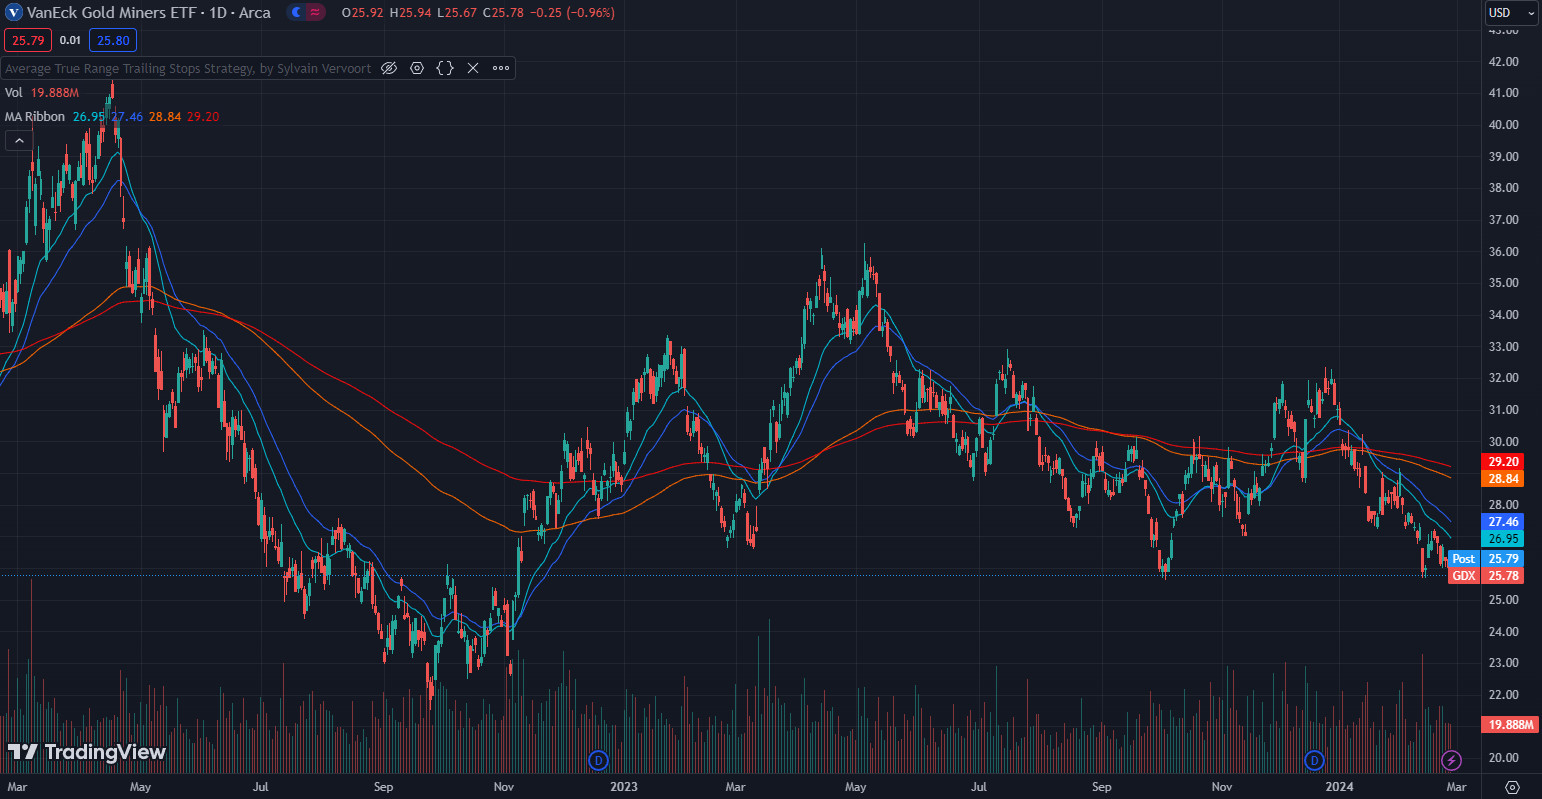
It’s interesting for a few reasons. The first reason to me is that if I didn’t know better and looked at this chart, I would assume that the chart of the gold price would look similar. But it doesn’t.
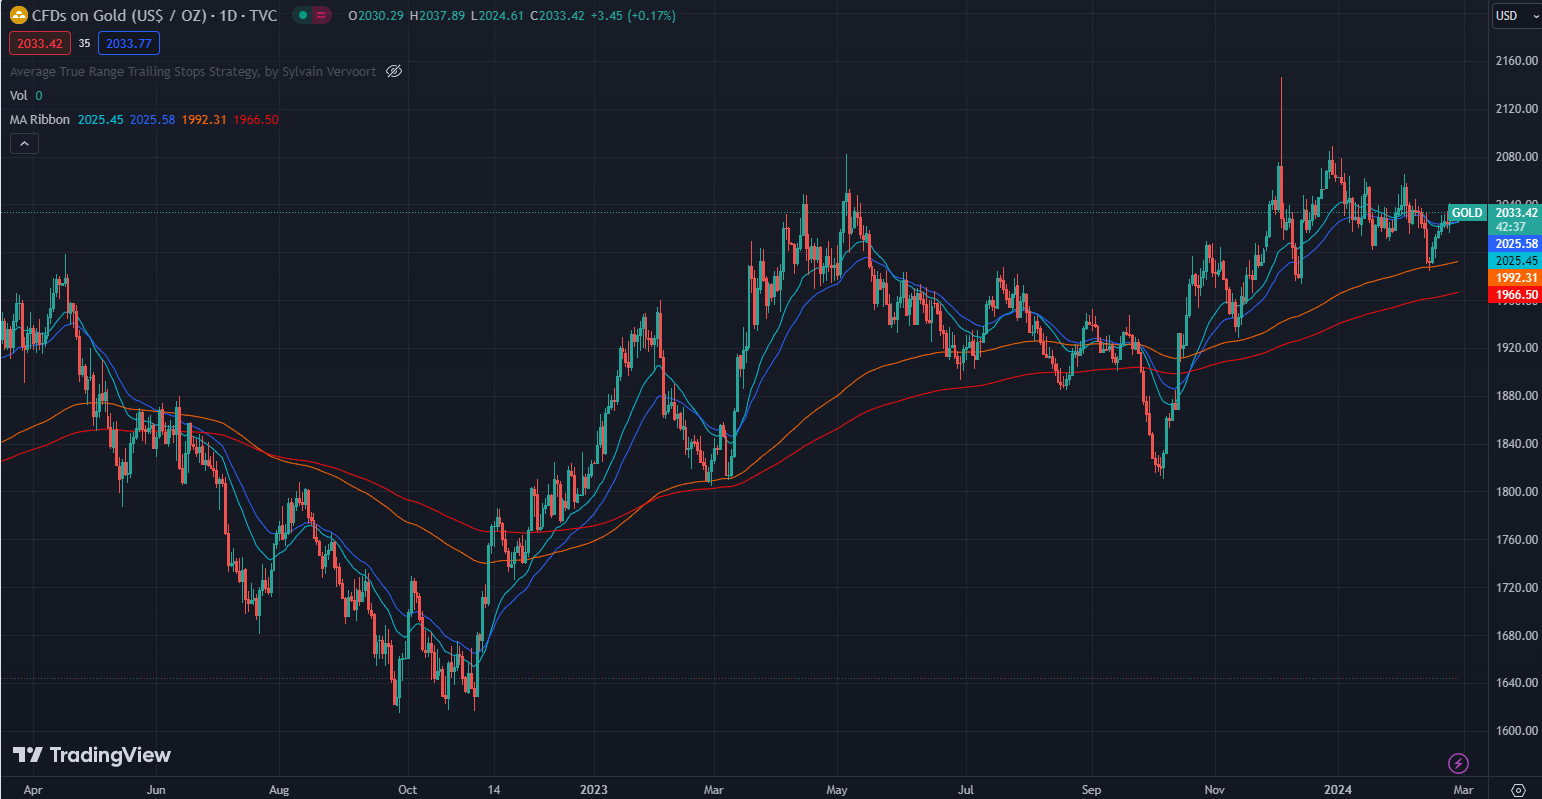
It did but since the start of the year there has been a large divergence. I’m not sure why that is. You would have to think at some point they will play catch up as the historical correlation is a strong one (as you would expect). As for the reason for the divergence – I don’t really know. In Australia, a lot of miners have seen their cost of production rising due to inflation and higher wages. This is the best explanation I can come up with. However, that isn’t unique to the start of 2024 …
The other thing that is interesting (and a bit sad) to me about the GDX Global Gold Miners ETF is that there only remains one Australian listed miner in the top 12 constituents list.
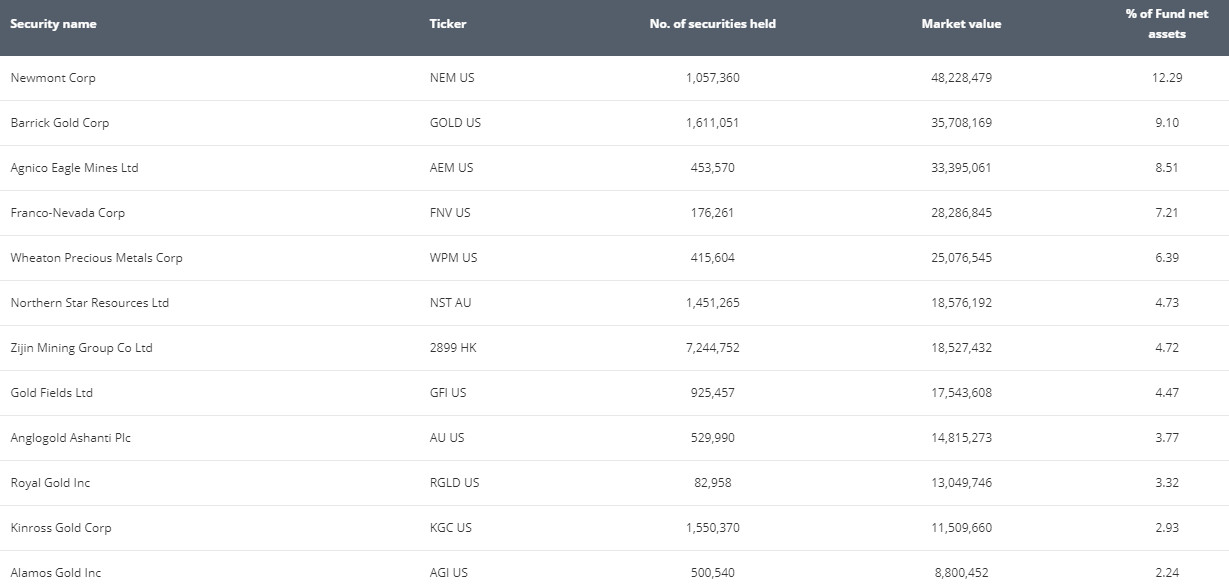
Some of those companies have operations in Australia but have simply swallowed one of out local companies to do so.
This puts it into perspective:
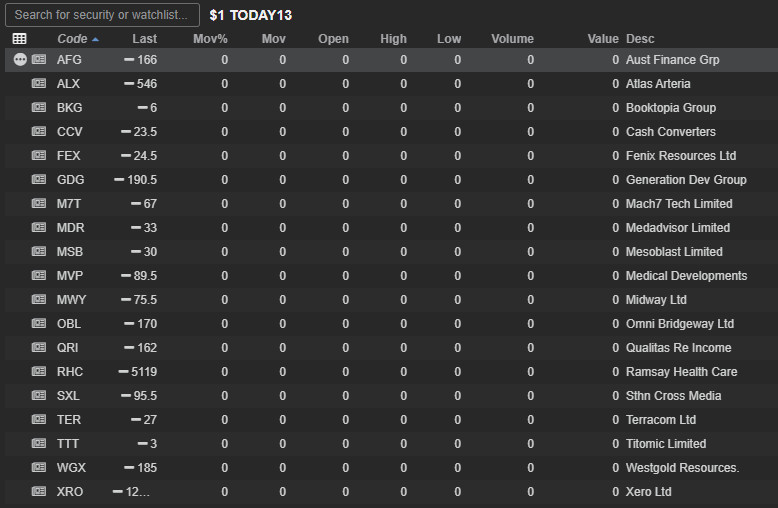
Today is the last day of reporting season for the ASX. Let’s have a look at some company reports and see if we can find any gems.
This is the hit list as at 8:58am. Many more will be added as the day goes on. Not the most inspiring bunch so far.
Medadvisor (ASX:MDR)
https://www.mymedadvisor.com/
Let’s have a look at (ASX:MDR), I’ve been noticing the share price going well lately.
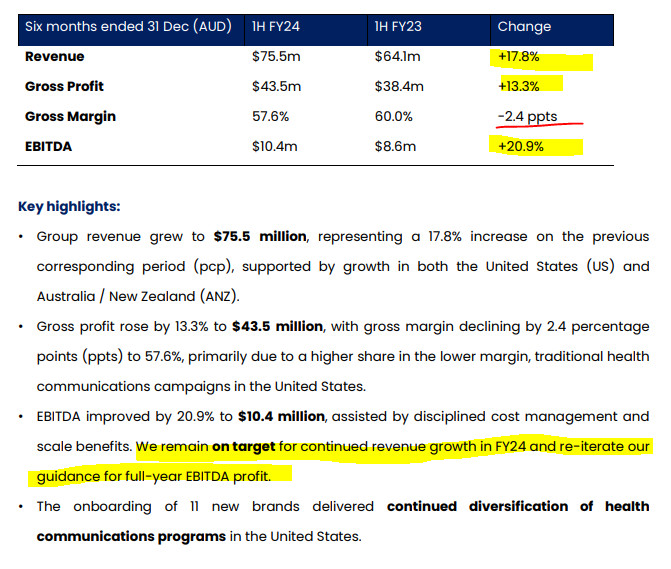
Looks solid enough. What’s not contained in those numbers is that they’ve been issuing shares and so there has been some dilution to shareholders over the comparable period.
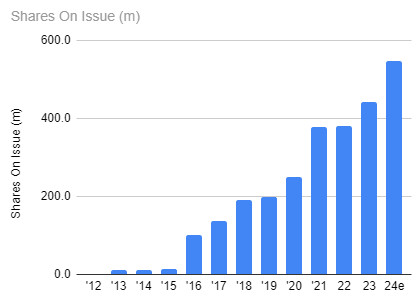
Not quite as solid when you put it that way, eh?
Life would be so much easier if companies were made to announce their numbers on a per share basis. It’s the way they do it in the US. Not sure why we don’t do it here.
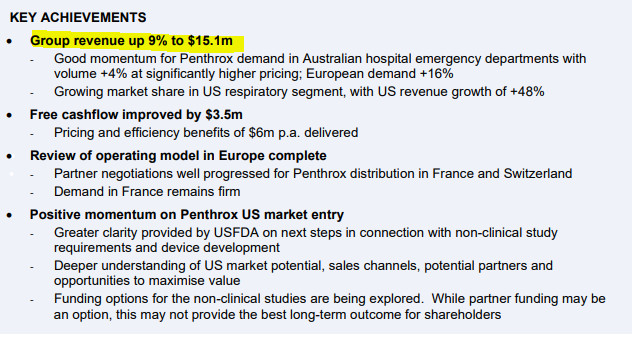
Medical Developments (ASX:MVP)
https://medicaldev.com/
I know one of our subscribers is a fan of this one. Great company but has struggled to turn a good product into profit in the past. Let’s see if they’ve addressed that.
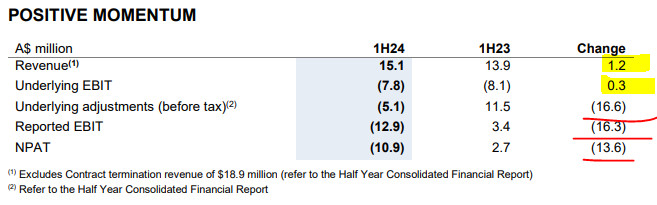
This reads a bit better than that.
.. and this reads best of all.
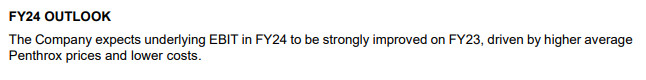
I’ll quickly put their numbers through the mincer and see what it produces.
Good product as I said that is producing ever increasing revenues. No issues there.
But this is where they have a problem There’s signs of improvement and the outlook is good so let’s hope they can achieve a dramatic return to form when they next report.
One thing to always be aware of when a company is Operating Cash Flow negative is to check the cash on had balance. ASX:MVP saw their cash on hand fall from $37.1M at the end of December 2022 to just $15.7M at the end of this December. If I was a shareholder of this company I would be concerned that there will be a capital raising sooner rather than later.
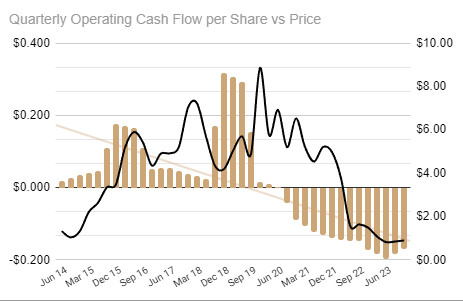
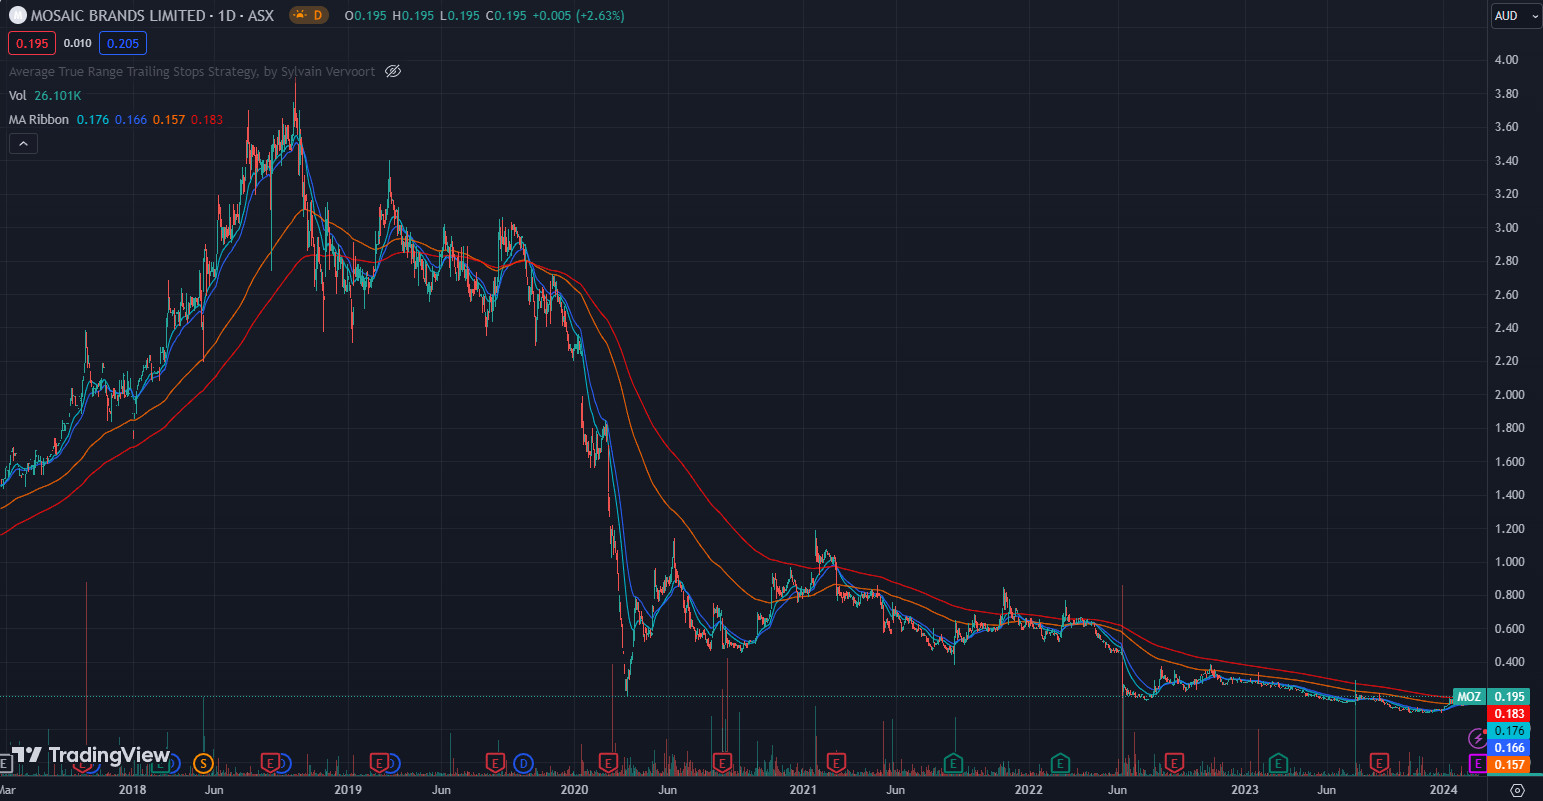
Mosaic Brands (ASX:MOZ)
https://www.mosaicbrandslimited.com.au/
I like a challenge, so the next stock I’ll take a look at is MOZ.
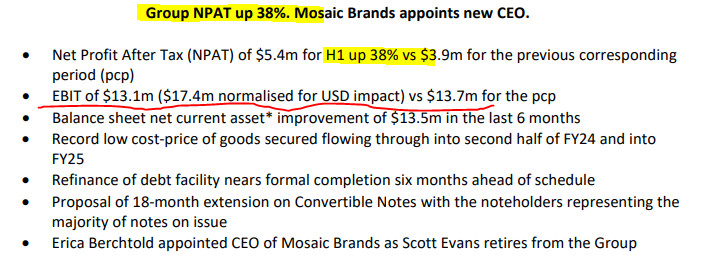
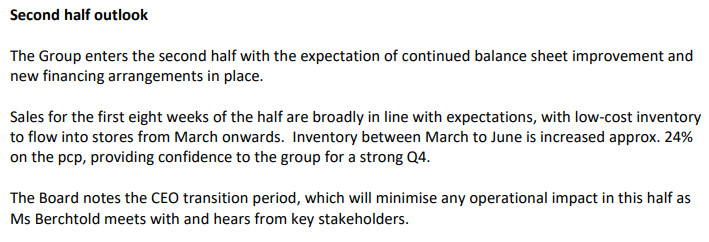
Not sure I want to keep looking. It’s been a basket case for some time. Looks like the new cheaper inventory is their latest attempt to turn things around. Sure revenues are up so they may be on their way but I also think you need to have a lot of hope to own this stock. For those that have been hopeful since 2019, that is yet to pay off.
Just a funny little observation. When you go to their website, their Favicon is just the default WordPress Icon. Come on guys, lift your game!
![]()
Last day of ASX earnings season isn’t offering up a lot to be inspired by. Perhaps there’s a reason why these companies have waited for the last minute to release their results.
Disclaimer: This information is provided purely for educational purposes. It takes no account of an individual’s personal financial circumstances and hence can in no way constitute financial advice. The above data may be subject to errors or inconsistencies for which the author takes no liability. It is imperative that all investors do their own research or if they need advice, seek it from a qualified financial adviser.
Thursday 29/2/24
Wed Feb 28, 2024
ASX earnings & outlook observations along with a look at broader market movements. FLT, DUG, EOS and DRO are looked at today.
LAST UPDATE – 10:55AM
AFTER THE MARKET OPEN
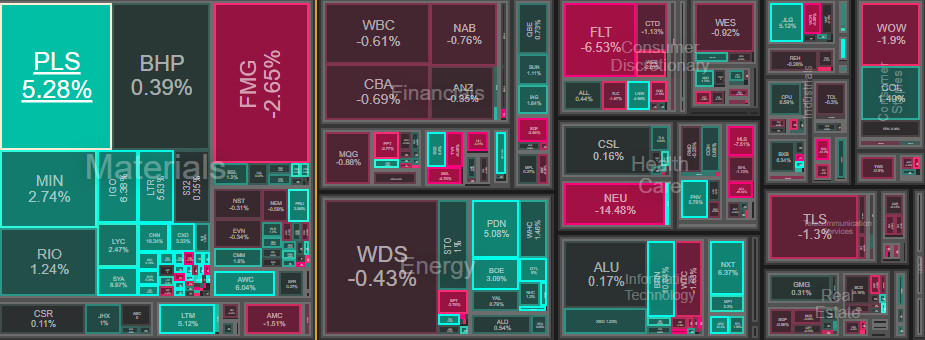
The move appears to be on in the Lithium stocks. The lithium price has started to move higher. It’s very early days and the trend remains firmly down but the large short positions in many of the Lithium stocks means movements will be sharp.
source: ASX Short Positions – Stocks Under The Hood
FLIGHT CENTRE (ASX:FLT)
https://www.flightcentre.com.au/
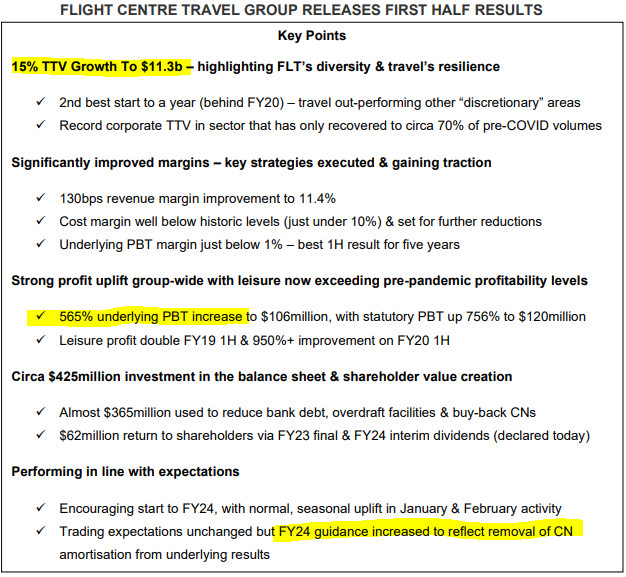
As is always the case with ASX:FLT, the focus is on the 2nd half outlook.
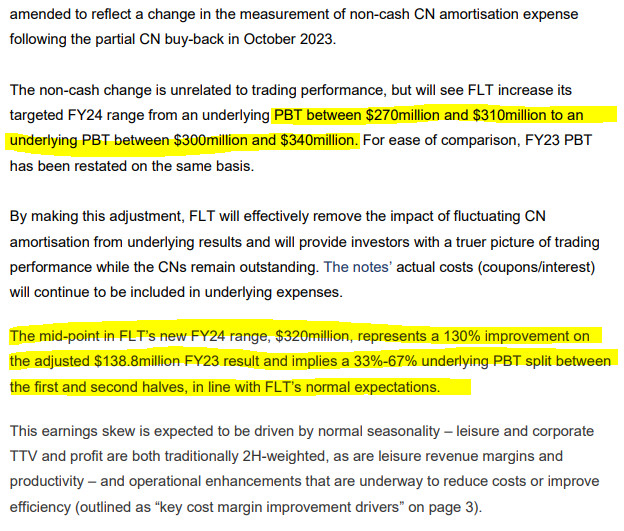
All in all it looks like they continue to deliver on their promises. Profitability is increasing faster than the top-line I’m guessing due in large part, to having closed so many shop-fronts during Covid.
Market doesn’t love the result though for some reason. The shares are currently down 6% in early trade.
BEFORE THE MARKET OPEN
The US market rose last night. I saw a headline questioning the relevance of the Dow Jones as an index. I have to agree, it seems redundant and doesn’t seem to reflect the broader market on a day-to-day basis.
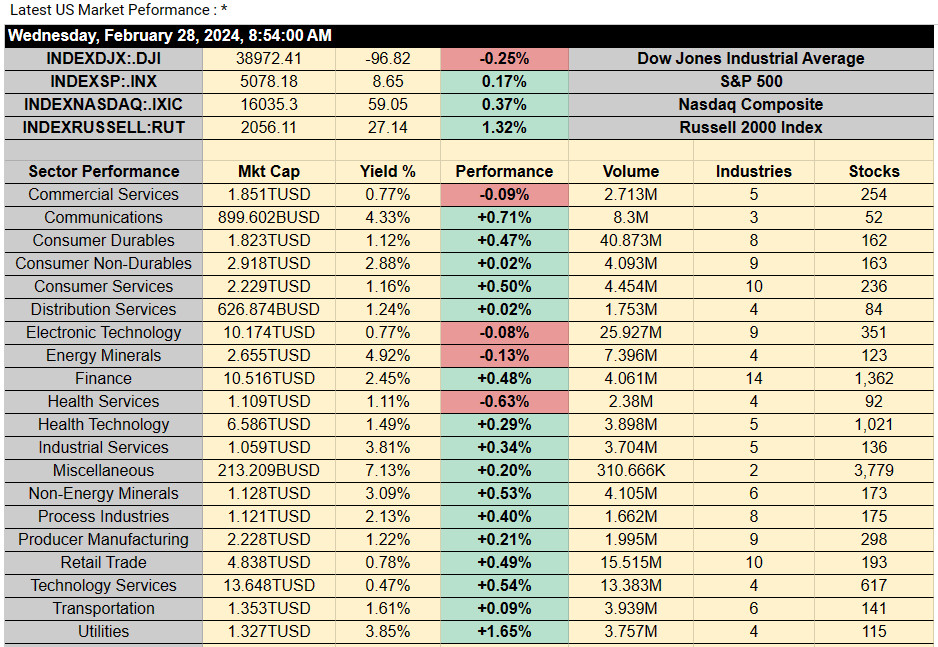
Source: https://stocksunderthehood.com/resources/us-sector-performance/
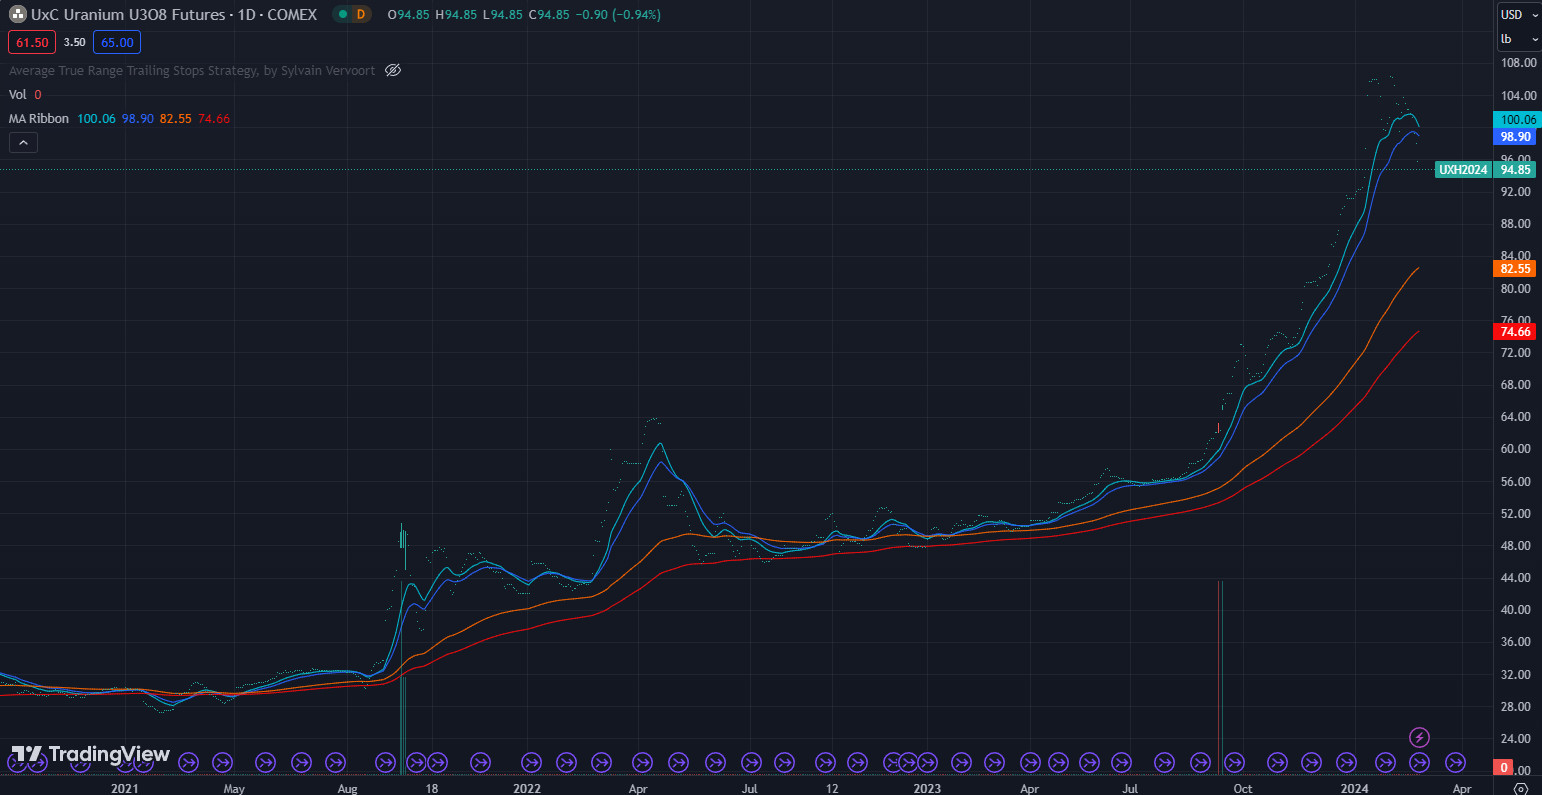
The short-term trend for Uranium seems to have broken.
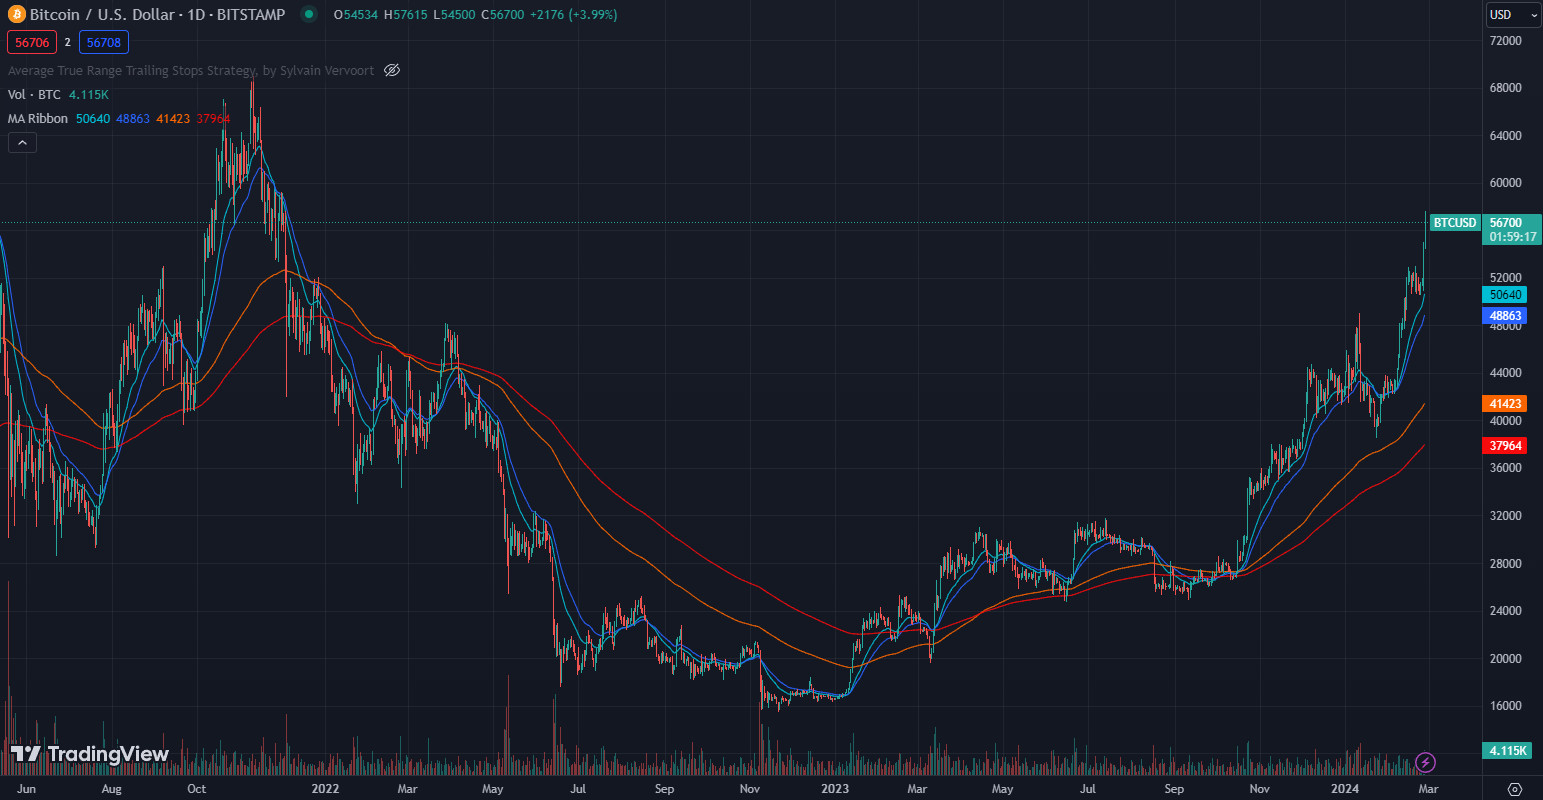
No such problems for Bitcoin
The Australian futures market suggest the ASX will open up 21 points.
Let’s look at some more company reports out today.
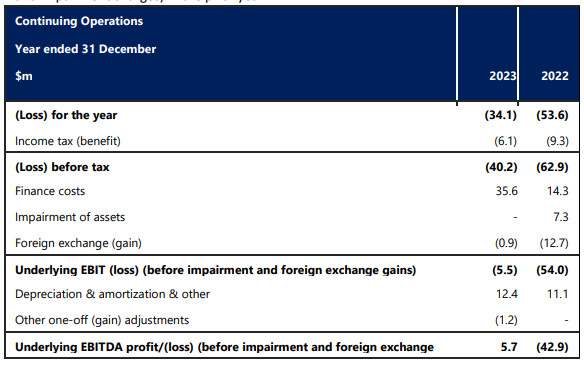
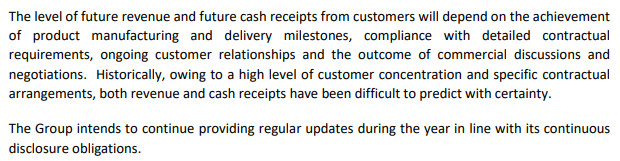
Dug Technology (ASX:DUG)
https://dug.com/
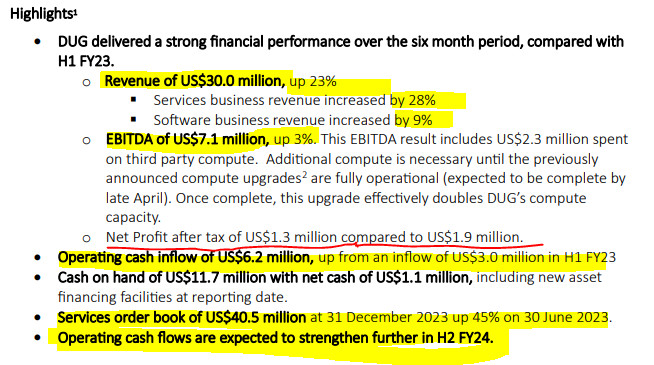
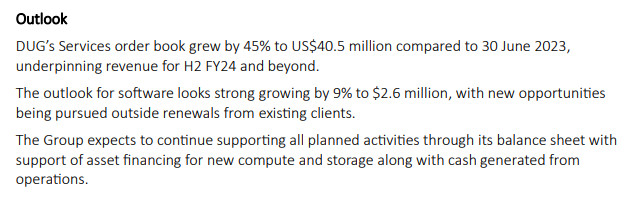
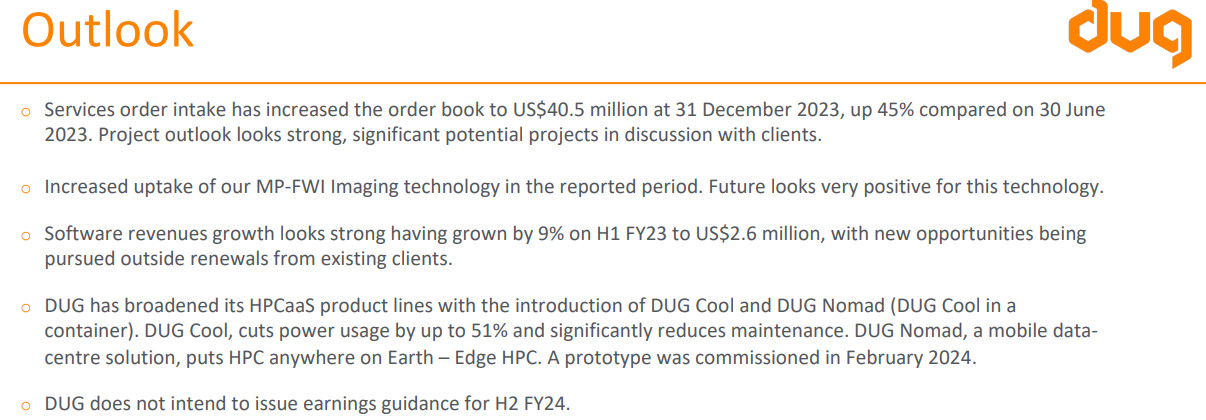
It will be interesting to see how the market responds to this. ASX:DUG has had a huge run into this result. They’re clearly in a strong growth upswing, so much so that they’ve incurred some costs using 3rd party capacity. Nevertheless, a lack of guidance makes it tricky especially when the stock has had such as strong run up to this result. It sounds like it’s a 2nd half-story but they won’t really say so.
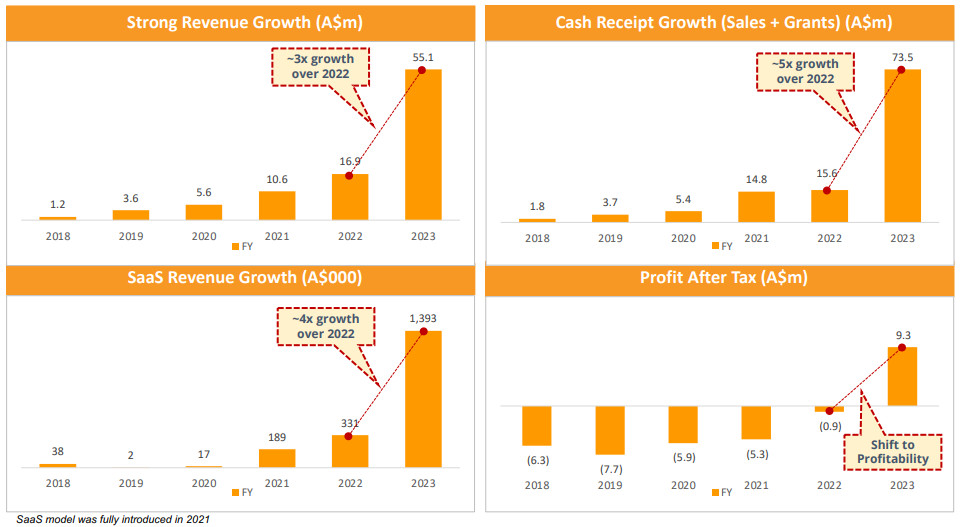
Electro Optic Systems (ASX:EOS)
https://eos-aus.com/
Still losing money but improving quickly. Those finance costs are a killer. I hope they can / have addressed that.
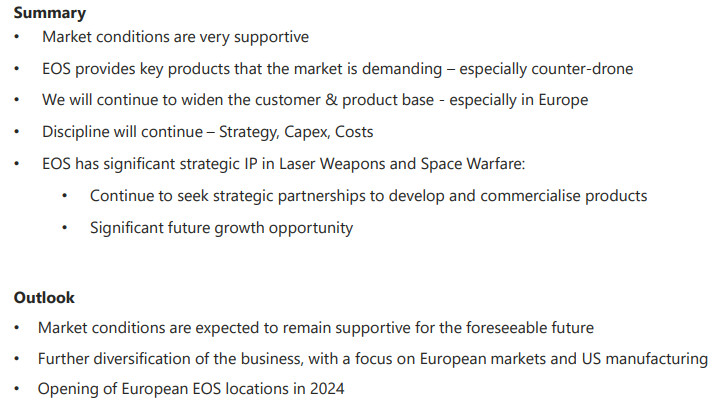
No outlook given. They’ve probably learned from the past when they’ve been inclined to disappoint the market.
All in all, there shouldn’t be too many surprises here as ASX:EOS do update the market on a quarterly basis and last did so only last month.
Droneshield (ASX:DRO)
https://www.droneshield.com/
Impressive numbers but there is nothing new here that hasn’t already been reported to the market.
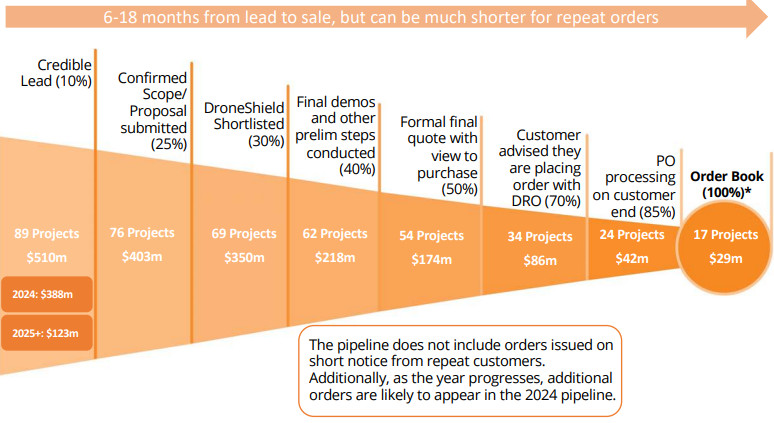
The order book looks a bit light-on. Hopefully they can convert a good chunk of that pipeline otherwise the 2023 result will be hard to match.
Disclaimer: This information is provided purely for educational purposes. It takes no account of an individual’s personal financial circumstances and hence can in no way constitute financial advice. The above data may be subject to errors or inconsistencies for which the author takes no liability. It is imperative that all investors do their own research or if they need advice, seek it from a qualified financial adviser.
Wed Feb 28, 2024