S&P/ASX 200 Information Technology Index measures the performance of IT sector companies on the ASX.
Ticker code: ^AXIJ
Sector: Technology | Industry: Index | Website: N/A
Market Information
Market Capitalisation
Enterprise Value
Shares Outstanding
Free Float [%]
Free Float Value
None
None
None
0.0
None
Balance Sheet & Quality
Equity
Cash
Debt
Return On Equity (ROE)
EBITDA 25 Margin [%]
Net Debt / Equity [%]
Rule of 40
None
None
None
None
None
0.0
None
Technicals & Short Data
3EMA Status
Volatility [%]
Value Traded Today
Average Daily Liquidity
Short [%]
Days To Cover
None None
$0
$24,750,988,391
None
0.0
Dividends
Previous Dividend
Last Dividend
Franking [%]
Ex-Div Date
Gross Yield [%]
None
None
None
None
None
Price Performance Snapshot
Last Traded Price
Change [%]
1 Week [%]
1 Month [%]
3 Months [%]
6 Months [%]
12 Months [%]
$2,236.700 1.3 -4.1 -20.8 -25.3 -4.1 -13.4
^AXIJ Price Chart with Volume and 3EMA
^AXIJ Short Positions
No chart available for this company.
HERE to understand why the above moving averages have been chosen.
ASX:MRE, managed by Metrics Credit Partners, is a stapled security offering exposure to diversified commercial real estate debt and equity investments in Australia and New Zealand. It generates income from debt instruments and potential equity upside.
Ticker code: MRE
Market Information
Market Capitalisation
Enterprise Value
Shares Outstanding
Free Float [%]
Free Float Value
$0
$0
None
0.0
$0
Balance Sheet & Quality
Equity
Cash
Debt
Return On Equity (ROE)
EBITDA 25 Margin [%]
Net Debt / Equity [%]
Rule of 40
None
$0
None
0.0
None
0.0
None
Technicals & Short Data
3EMA Status
Volatility [%]
Value Traded Today
Average Daily Liquidity
Short [%]
Days To Cover
Positive 10.9
$360,202
$527,926
None
0.0
Dividends
Previous Dividend
Last Dividend
Franking [%]
Ex-Div Date
Gross Yield [%]
$0.008
$0.008
40.0
2025-11-28
0.0
Price Performance Snapshot
Last Traded Price
Change [%]
1 Week [%]
1 Month [%]
3 Months [%]
6 Months [%]
12 Months [%]
$1.935 -0.8 0.4 5.0 -2.5 3.5 5.9
MRE Price Chart with Volume and 3EMA
MRE Short Positions
No chart available for this company.
HERE to understand why the above moving averages have been chosen.
Ticker code: ^AXTJ
^AXTJ Red Flags & Risk Indicators✅
⚠️ RED FLAGS: 0 identified
No red flags detected.
Income Statement
Revenue 2024 Per Share
Revenue 2025e Per Share
Revenue 2026e Per Share
Revenue 24 to 25e [%]
Revenue 25e to 26e [%]
EBITDA 2024 Per Share
EBITDA 2025e Per Share
EBITDA 2026e Per Share
EBITDA 24 to 25e [%]
EBITDA 25e to 26e [%]
None
None
None
None
None
None
None
None
None
None
^AXTJ Revenue Per Share (2012–2027)
^AXTJ Earnings before Interest, Tax, Depreciation and Amortisation (EBITDA) Per Share (2012–2027)
^AXTJ Normalised Earnings Per Share (EPS) (2012–2027)
Valuation
Price To Sales
Price To Book
PER 2023
PER 2024
13Y Median PER Low
PER 2025e
13Y Median PER High
PER 2026e
Last Updated
None
None
None
None
None
None
None
None
None
^AXTJ Yearly Price Earnings Ratio (PER) Highs and Lows
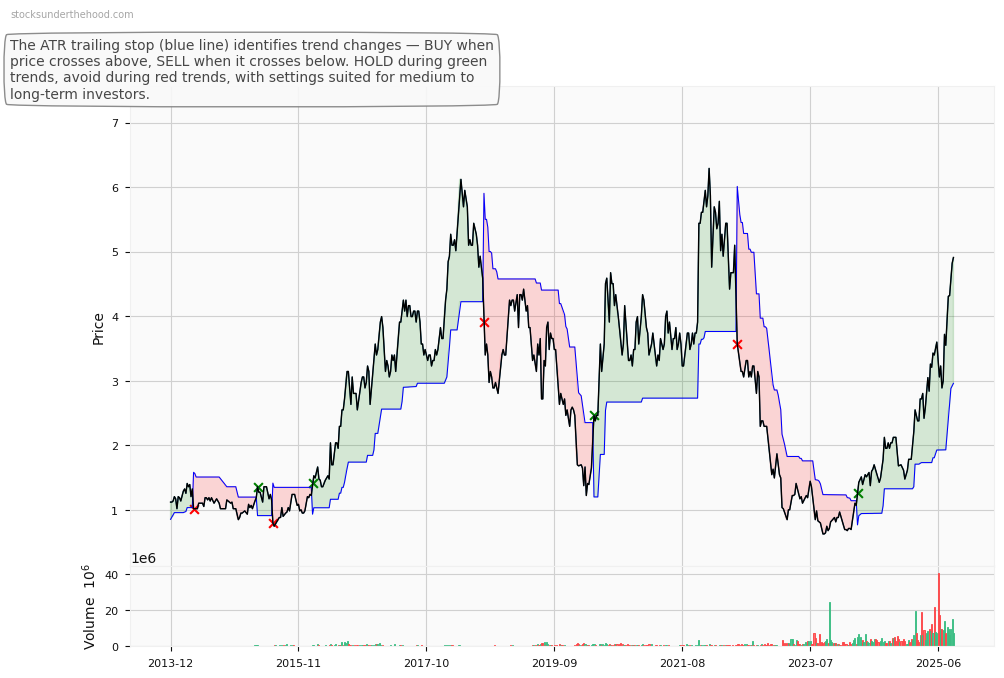
^AXTJ Weekly Price Chart with Average True Range (ATR) Trailing Stop (10-Year View)
Ticker code: ^AXIJ
^AXIJ Red Flags & Risk Indicators✅
⚠️ RED FLAGS: 0 identified
No red flags detected.
Income Statement
Revenue 2024 Per Share
Revenue 2025e Per Share
Revenue 2026e Per Share
Revenue 24 to 25e [%]
Revenue 25e to 26e [%]
EBITDA 2024 Per Share
EBITDA 2025e Per Share
EBITDA 2026e Per Share
EBITDA 24 to 25e [%]
EBITDA 25e to 26e [%]
None
None
None
None
None
None
None
None
None
None
^AXIJ Revenue Per Share (2012–2027)
^AXIJ Earnings before Interest, Tax, Depreciation and Amortisation (EBITDA) Per Share (2012–2027)
^AXIJ Normalised Earnings Per Share (EPS) (2012–2027)
Valuation
Price To Sales
Price To Book
PER 2023
PER 2024
13Y Median PER Low
PER 2025e
13Y Median PER High
PER 2026e
Last Updated
None
None
None
None
None
None
None
None
None
^AXIJ Yearly Price Earnings Ratio (PER) Highs and Lows
^AXIJ Weekly Price Chart with Average True Range (ATR) Trailing Stop (10-Year View)
S&P/ASX 200 Telecommunication Services Index tracks telecom sector companies on the ASX.
Ticker code: ^AXTJ
Sector: Communication Services | Industry: Index | Website: N/A
Market Information
Market Capitalisation
Enterprise Value
Shares Outstanding
Free Float [%]
Free Float Value
None
None
None
0.0
None
Balance Sheet & Quality
Equity
Cash
Debt
Return On Equity (ROE)
EBITDA 25 Margin [%]
Net Debt / Equity [%]
Rule of 40
None
None
None
None
None
0.0
None
Technicals & Short Data
3EMA Status
Volatility [%]
Value Traded Today
Average Daily Liquidity
Short [%]
Days To Cover
None None
$0
$62,690,688,912
None
0.0
Dividends
Previous Dividend
Last Dividend
Franking [%]
Ex-Div Date
Gross Yield [%]
None
None
None
None
None
Price Performance Snapshot
Last Traded Price
Change [%]
1 Week [%]
1 Month [%]
3 Months [%]
6 Months [%]
12 Months [%]
$1,797.200 None
-0.4 -2.3 -6.8 -2.6 5.5
^AXTJ Price Chart with Volume and 3EMA
^AXTJ Short Positions
No chart available for this company.
HERE to understand why the above moving averages have been chosen.
S&P/ASX 200 Information Technology Index measures the performance of IT sector companies on the ASX.
Ticker code: ^AXIJ
Sector: Technology | Industry: Index | Website: N/A
Market Information
Market Capitalisation
Enterprise Value
Shares Outstanding
Free Float [%]
Free Float Value
None
None
None
0.0
None
Balance Sheet & Quality
Equity
Cash
Debt
Return On Equity (ROE)
EBITDA 25 Margin [%]
Net Debt / Equity [%]
Rule of 40
None
None
None
None
None
0.0
None
Technicals & Short Data
3EMA Status
Volatility [%]
Value Traded Today
Average Daily Liquidity
Short [%]
Days To Cover
None None
$0
$26,167,918,920
None
0.0
Dividends
Previous Dividend
Last Dividend
Franking [%]
Ex-Div Date
Gross Yield [%]
None
None
None
None
None
Price Performance Snapshot
Last Traded Price
Change [%]
1 Week [%]
1 Month [%]
3 Months [%]
6 Months [%]
12 Months [%]
$2,370.000 -0.8 3.5 -11.6 -18.7 -17.7 -19.5
^AXIJ Price Chart with Volume and 3EMA
^AXIJ Short Positions
No chart available for this company.
HERE to understand why the above moving averages have been chosen.
Ticker code: ^RUT
^RUT Red Flags & Risk Indicators✅
⚠️ RED FLAGS: 0 identified
No red flags detected.
Income Statement
Revenue 2024 Per Share
Revenue 2025e Per Share
Revenue 2026e Per Share
Revenue 24 to 25e [%]
Revenue 25e to 26e [%]
EBITDA 2024 Per Share
EBITDA 2025e Per Share
EBITDA 2026e Per Share
EBITDA 24 to 25e [%]
EBITDA 25e to 26e [%]
None
None
None
None
None
None
None
None
None
None
^RUT Revenue Per Share (2012–2027)
^RUT Earnings before Interest, Tax, Depreciation and Amortisation (EBITDA) Per Share (2012–2027)
^RUT Normalised Earnings Per Share (EPS) (2012–2027)
Valuation
Price To Sales
Price To Book
PER 2023
PER 2024
13Y Median PER Low
PER 2025e
13Y Median PER High
PER 2026e
Last Updated
None
None
None
None
None
None
None
None
None
^RUT Yearly Price Earnings Ratio (PER) Highs and Lows
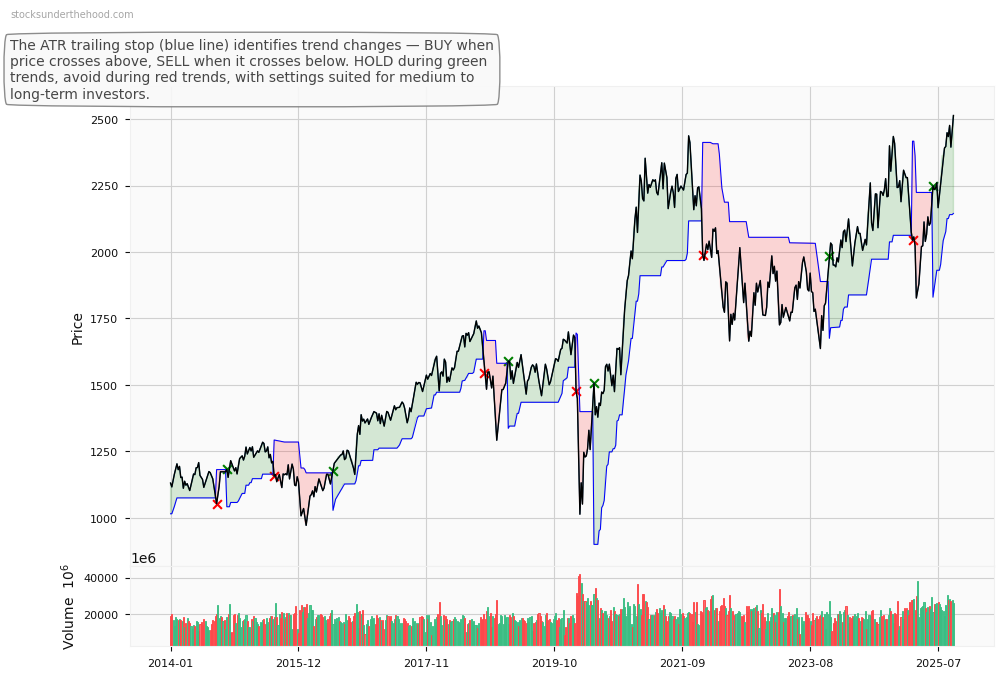
^RUT Weekly Price Chart with Average True Range (ATR) Trailing Stop (10-Year View)
Russell 2000 Index measures the performance of approximately 2,000 smallest-cap American companies in the Russell 3000 Index.
Ticker code: ^RUT
Sector: Small Caps | Industry: Index | Website: N/A
Market Information
Market Capitalisation
Enterprise Value
Shares Outstanding
Free Float [%]
Free Float Value
None
None
None
0.0
None
Balance Sheet & Quality
Equity
Cash
Debt
Return On Equity (ROE)
EBITDA 25 Margin [%]
Net Debt / Equity [%]
Rule of 40
None
None
None
None
None
0.0
None
Technicals & Short Data
3EMA Status
Volatility [%]
Value Traded Today
Average Daily Liquidity
Short [%]
Days To Cover
None None
$0
$13,629,520,086,754
None
0.0
Dividends
Previous Dividend
Last Dividend
Franking [%]
Ex-Div Date
Gross Yield [%]
None
None
None
None
None
Price Performance Snapshot
Last Traded Price
Change [%]
1 Week [%]
1 Month [%]
3 Months [%]
6 Months [%]
12 Months [%]
$2,500.430 0.6 3.6 0.8 6.3 18.9 4.4
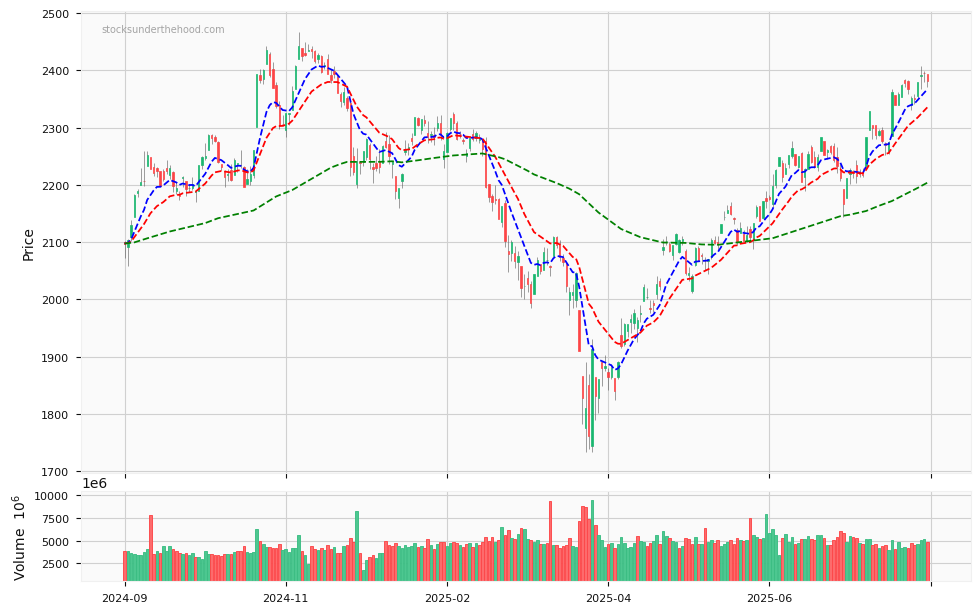
^RUT Price Chart with Volume and 3EMA
^RUT Short Positions
No chart available for this company.
HERE to understand why the above moving averages have been chosen.
Russell 2000 Index measures the performance of approximately 2,000 smallest-cap American companies in the Russell 3000 Index.
Ticker code: ^RUT
Sector: Index | Industry: Index | Website: N/A
Market Information
Market Capitalisation
Enterprise Value
Shares Outstanding
Free Float [%]
Free Float Value
None
None
None
0.0
#VALUE!
Balance Sheet & Quality
Equity
Cash
Debt
Return On Equity (ROE)
EBITDA 24 Margin [%]
Net Debt / Equity [%]
Rule of 40
None
None
None
None
None
0.0
None
Technicals & Short Data
3EMA Status
Volatility [%]
Value Traded Today
Average Daily Liquidity
Short [%]
Days To Cover
None None
$4,806,394,681,422
$31,480,961,821,453
None
0.0
Dividends
Previous Dividend
Last Dividend
Franking [%]
Ex-Div Date
Gross Yield [%]
None
None
None
None
None
^RUT Price Chart with Volume and 3EMA
^RUT Short Positions
No chart available for this company.
HERE to understand why the above moving averages have been chosen.
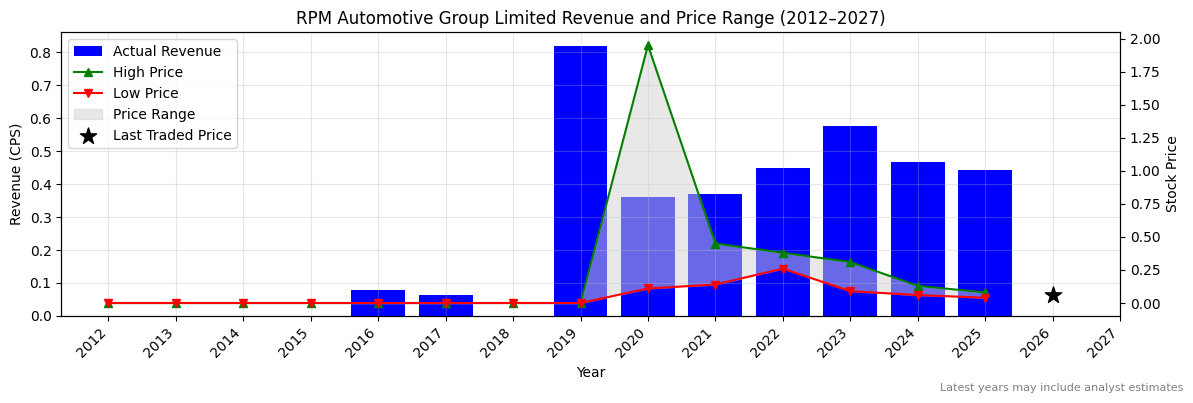
Ticker code: RPM
RPM Red Flags & Risk Indicators⚠️
⚠️ RED FLAGS: 2 identified
Low Operating Margin
Falling Earnings
Income Statement
Revenue 2024 Per Share
Revenue 2025e Per Share
Revenue 2026e Per Share
Revenue 24 to 25e [%]
Revenue 25e to 26e [%]
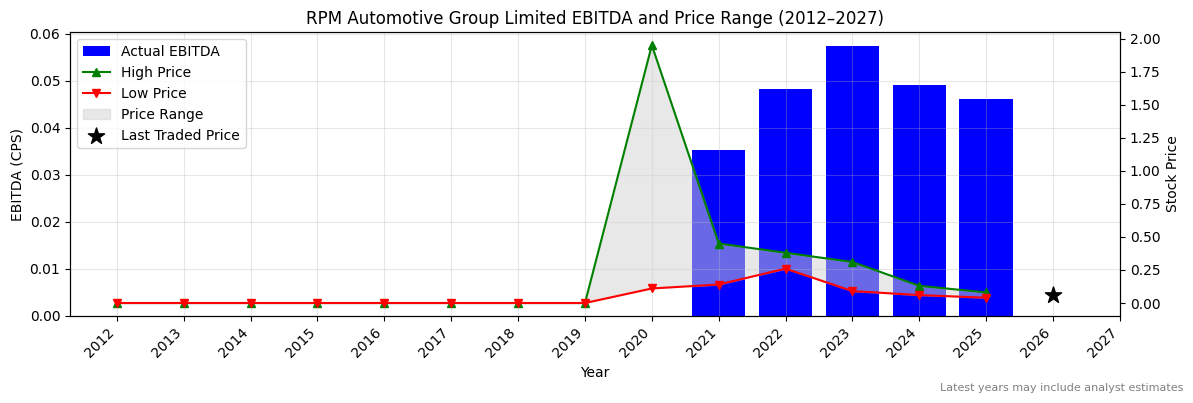
EBITDA 2024 Per Share
EBITDA 2025e Per Share
EBITDA 2026e Per Share
EBITDA 24 to 25e [%]
EBITDA 25e to 26e [%]
0.46865
0.44263
None
-5.6 None
0.04915
0.04611
None
-6.2 None
RPM Revenue Per Share (2012–2027)❌
RPM Earnings before Interest, Tax, Depreciation and Amortisation (EBITDA) Per Share (2012–2027)❌
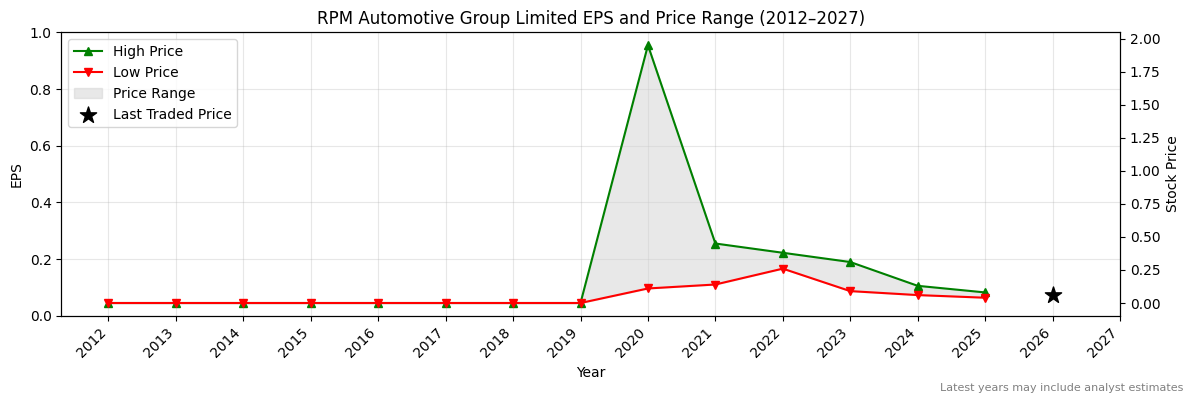
RPM Normalised Earnings Per Share (EPS) (2012–2027)
Valuation
Price To Sales
Price To Book
PER 2023
PER 2024
13Y Median PER Low
PER 2025e
13Y Median PER High
PER 2026e
Last Updated
0.2
0.3
None
None
None
None
None
None
2/6/25
RPM Yearly Price Earnings Ratio (PER) Highs and Lows
RPM Weekly Price Chart with Average True Range (ATR) Trailing Stop (10-Year View)
RPM Automotive Group Limited (ASX:RPM) manufactures and sells tyres, parts, and accessories for motorsport and commercial vehicles in Australia. It operates through Motorsport, Repairs, Wheels, and Performance segments.
Ticker code: RPM
Market Information
Market Capitalisation
Enterprise Value
Shares Outstanding
Free Float [%]
Free Float Value
$14,910,792
$53,725,253
271105317
61.91
$9,230,675
Balance Sheet & Quality
Equity
Cash
Debt
Return On Equity (ROE)
EBITDA 25 Margin [%]
Net Debt / Equity [%]
Rule of 40
$57,745,433
$6,757,147
$45,571,608
0.0
10.4 67.2
4.9
Technicals & Short Data
3EMA Status
Volatility [%]
Value Traded Today
Average Daily Liquidity
Short [%]
Days To Cover
Negative 17.0
$8,853
$10,793
0.0
0.0
Dividends
Previous Dividend
Last Dividend
Franking [%]
Ex-Div Date
Gross Yield [%]
None
None
None
None
0.0
Price Performance Snapshot
Last Traded Price
Change [%]
1 Week [%]
1 Month [%]
3 Months [%]
6 Months [%]
12 Months [%]
$0.055 -3.5 -6.8 -12.7 -16.7 -8.3 -26.7
RPM Price Chart with Volume and 3EMA
RPM Short Positions
HERE to understand why the above moving averages have been chosen.
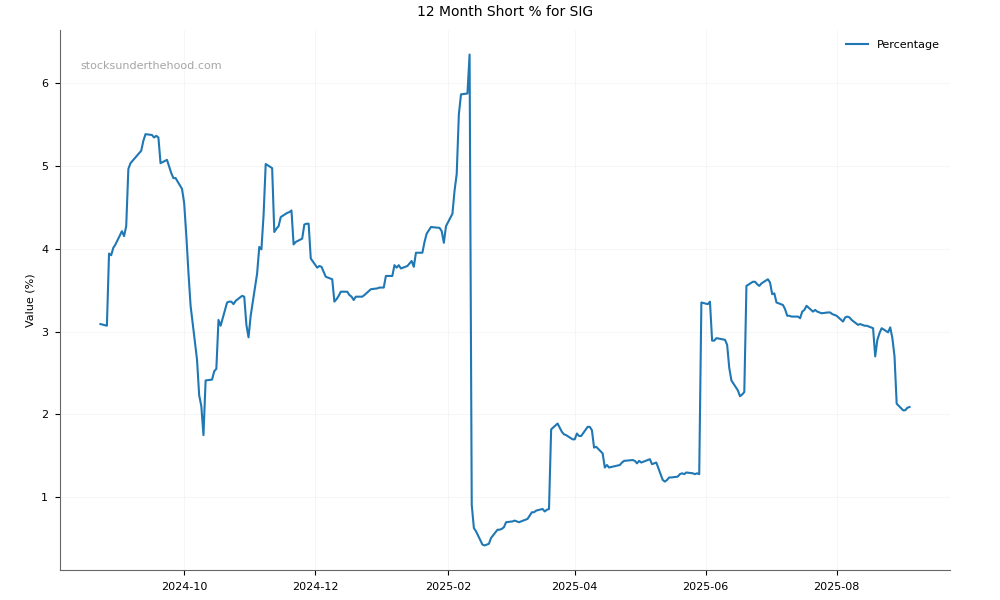
Sigma Healthcare Limited Fundamental, Technical and Short Position Analysis
Sigma Healthcare Limited is a pharmaceutical wholesaler and distributor, supplying a wide range of pharmaceutical products and services to pharmacies across Australia.
Ticker code: ASX:SIG
Market Information
Market Capitalisation
Enterprise Value
Shares Outstanding
Free Float [%] Free Float Value
$36,016,344,177
$4,408,153,088
11543700480
11.79
$4,245,382,905
Balance Sheet & Quality
Equity
Cash
Debt
Return On Equity (ROE)
EBITDA 24 Margin [%]
Net Debt / Equity [%]
Rule of 40
$5,921,918,465
$234,158,000
$137,636,992
1.9
1.8 -1.6 39.7
Technicals & Short Data
3EMA Status Volatility [%]
Value Traded Today
Average Daily Liquidity
Short [%] Days To Cover
Positive 4.2
$149,634,586
$139,382,685
1.29
3.3
Dividends
Previous Dividend
Last Dividend
Franking [%]
Ex-Div Date
Gross Yield [%]
$0.005
None
100.0
2024-10-01
0.2
ASX:SIG Price Chart with Volume and 3EMA over the Last 12 Months
Last Traded Price
Change [%]
1 Week [%]
1 Month [%]
3 Months [%]
6 Months [%]
12 Months [%]
$3.120 -1.6 10.2 3.7 6.8 22.8 150.5
ASX:SIG Short Positions over the Last 12 Months
Click HERE to understand why the above moving averages have been chosen.
Ticker code: None
None Red Flags & Risk Indicators✅
⚠️ RED FLAGS: 0 identified
No red flags detected.
Income Statement
Revenue 2024 Per Share
Revenue 2025e Per Share
Revenue 2026e Per Share
Revenue 24 to 25e [%]
Revenue 25e to 26e [%]
EBITDA 2024 Per Share
EBITDA 2025e Per Share
EBITDA 2026e Per Share
EBITDA 24 to 25e [%]
EBITDA 25e to 26e [%]
None
None
None
None
None
None
None
None
None
None
None Revenue Per Share (2012–2027)
None Earnings before Interest, Tax, Depreciation and Amortisation (EBITDA) Per Share (2012–2027)
None Normalised Earnings Per Share (EPS) (2012–2027)
Valuation
Price To Sales
Price To Book
PER 2023
PER 2024
13Y Median PER Low
PER 2025e
13Y Median PER High
PER 2026e
Last Updated
None
None
None
None
None
None
None
None
None
None Yearly Price Earnings Ratio (PER) Highs and Lows
None Weekly Price Chart with Average True Range (ATR) Trailing Stop (10-Year View)
Today’s Changes
Update: 30-11-2025 15:49:54 | Learn about 3EMA
3EMA Signal Changes Since Yesterday
Ticker
Short %
Sector
Signal Change
AIS —
Basic Materials
Mixed Trend → Strong Uptrend
DGL 0.08%
Basic Materials
Mixed Trend → Strong Uptrend
FLT 10.89%
Consumer Cyclical
Mixed Trend → Strong Uptrend
FPH 0.02%
Healthcare
Mixed Trend → Strong Uptrend
IFM 0.00%
Technology
Mixed Trend → Strong Uptrend
LGI 0.00%
Utilities
Mixed Trend → Strong Uptrend
MGH 2.86%
Industrials
Mixed Trend → Strong Uptrend
MRE —
Real Estate
Mixed Trend → Strong Uptrend
NCK 3.56%
Consumer Cyclical
Mixed Trend → Strong Uptrend
PPS 0.00%
Financial Services
Mixed Trend → Strong Uptrend
QQQ —
Index
Mixed Trend → Strong Uptrend
SSM 0.20%
Industrials
Mixed Trend → Strong Uptrend
WEB 2.35%
Consumer Cyclical
Mixed Trend → Strong Uptrend
AOV 2.22%
Consumer Cyclical
Strong Downtrend → Mixed Trend
BMT —
Healthcare
Strong Downtrend → Mixed Trend
CTD 9.81%
Consumer Cyclical
Strong Downtrend → Mixed Trend
DGT 8.05%
Real Estate
Strong Downtrend → Mixed Trend
DRR 2.21%
Basic Materials
Strong Downtrend → Mixed Trend
DXB 0.27%
Healthcare
Strong Downtrend → Mixed Trend
JHX 3.15%
Basic Materials
Strong Downtrend → Mixed Trend
PLY 0.09%
Communication Services
Strong Downtrend → Mixed Trend
SKO 0.00%
Technology
Strong Downtrend → Mixed Trend
FBU —
Basic Materials
Strong Uptrend → Mixed Trend
RZI —
Technology
Strong Uptrend → Mixed Trend
TLS 0.33%
Communication Services
Strong Uptrend → Mixed Trend
BET 0.24%
Consumer Cyclical
Mixed Trend → Strong Downtrend
SMP 0.00%
Technology
Mixed Trend → Strong Downtrend
VCX 1.43%
Real Estate
Mixed Trend → Strong Downtrend
X2M 0.00%
Technology
Mixed Trend → Strong Downtrend
Yesterday’s Changes
Update: 30-11-2025 15:48:54 | Learn about 3EMA
3EMA Signal Changes Since Yesterday
Ticker
Short %
Sector
Signal Change
AIS —
Basic Materials
Mixed Trend → Strong Uptrend
DGL 0.08%
Basic Materials
Mixed Trend → Strong Uptrend
FLT 10.89%
Consumer Cyclical
Mixed Trend → Strong Uptrend
FPH 0.02%
Healthcare
Mixed Trend → Strong Uptrend
IFM 0.00%
Technology
Mixed Trend → Strong Uptrend
LGI 0.00%
Utilities
Mixed Trend → Strong Uptrend
MGH 2.86%
Industrials
Mixed Trend → Strong Uptrend
MRE —
Real Estate
Mixed Trend → Strong Uptrend
NCK 3.56%
Consumer Cyclical
Mixed Trend → Strong Uptrend
PPS 0.00%
Financial Services
Mixed Trend → Strong Uptrend
QQQ —
Index
Mixed Trend → Strong Uptrend
SSM 0.20%
Industrials
Mixed Trend → Strong Uptrend
WEB 2.35%
Consumer Cyclical
Mixed Trend → Strong Uptrend
AOV 2.22%
Consumer Cyclical
Strong Downtrend → Mixed Trend
BMT —
Healthcare
Strong Downtrend → Mixed Trend
CTD 9.81%
Consumer Cyclical
Strong Downtrend → Mixed Trend
DGT 8.05%
Real Estate
Strong Downtrend → Mixed Trend
DRR 2.21%
Basic Materials
Strong Downtrend → Mixed Trend
DXB 0.27%
Healthcare
Strong Downtrend → Mixed Trend
JHX 3.15%
Basic Materials
Strong Downtrend → Mixed Trend
PLY 0.09%
Communication Services
Strong Downtrend → Mixed Trend
SKO 0.00%
Technology
Strong Downtrend → Mixed Trend
FBU —
Basic Materials
Strong Uptrend → Mixed Trend
RZI —
Technology
Strong Uptrend → Mixed Trend
TLS 0.33%
Communication Services
Strong Uptrend → Mixed Trend
BET 0.24%
Consumer Cyclical
Mixed Trend → Strong Downtrend
SMP 0.00%
Technology
Mixed Trend → Strong Downtrend
VCX 1.43%
Real Estate
Mixed Trend → Strong Downtrend
X2M 0.00%
Technology
Mixed Trend → Strong Downtrend
2 Days Ago
Update: 28-11-2025 22:45:05 | Learn about 3EMA
3EMA Signal Changes Since Yesterday
Ticker
Short %
Sector
Signal Change
ASK —
Real Estate
Mixed Trend → Strong Uptrend
BRG 7.02%
Consumer Cyclical
Mixed Trend → Strong Uptrend
GNP 0.00%
Industrials
Mixed Trend → Strong Uptrend
HCW —
Real Estate
Mixed Trend → Strong Uptrend
LGL 0.00%
Consumer Defensive
Mixed Trend → Strong Uptrend
MTM —
Basic Materials
Mixed Trend → Strong Uptrend
MVE —
nan
Mixed Trend → Strong Uptrend
MVF 3.39%
Healthcare
Mixed Trend → Strong Uptrend
MYS 0.41%
Financial Services
Mixed Trend → Strong Uptrend
PPE 0.01%
Industrials
Mixed Trend → Strong Uptrend
RDY 0.11%
Technology
Mixed Trend → Strong Uptrend
RHC 3.25%
Healthcare
Mixed Trend → Strong Uptrend
RPL 0.52%
Financial Services
Mixed Trend → Strong Uptrend
SHV 2.88%
Consumer Defensive
Mixed Trend → Strong Uptrend
SVL 0.66%
Consumer Defensive
Mixed Trend → Strong Uptrend
WIRE —
Basic Materials
Mixed Trend → Strong Uptrend
XRG —
Consumer Cyclical
Mixed Trend → Strong Uptrend
IMM —
Healthcare
Strong Downtrend → Strong Uptrend
SRL —
Industrials
Strong Downtrend → Strong Uptrend
VMT —
Consumer Cyclical
Strong Downtrend → Strong Uptrend
ABG —
Real Estate
Strong Downtrend → Mixed Trend
BET 0.24%
Consumer Cyclical
Strong Downtrend → Mixed Trend
BXB 0.41%
Industrials
Strong Downtrend → Mixed Trend
CUV 9.19%
Healthcare
Strong Downtrend → Mixed Trend
CWY 1.25%
Industrials
Strong Downtrend → Mixed Trend
GWA —
Industrials
Strong Downtrend → Mixed Trend
ING 4.62%
Consumer Defensive
Strong Downtrend → Mixed Trend
IPG 0.17%
Industrials
Strong Downtrend → Mixed Trend
KGN 2.03%
Consumer Cyclical
Strong Downtrend → Mixed Trend
KSL 0.00%
Financial Services
Strong Downtrend → Mixed Trend
MAQ 2.55%
Technology
Strong Downtrend → Mixed Trend
MGH 2.86%
Industrials
Strong Downtrend → Mixed Trend
OBL 2.06%
Financial Services
Strong Downtrend → Mixed Trend
PFP 4.05%
Consumer Cyclical
Strong Downtrend → Mixed Trend
TOT —
Real Estate
Strong Downtrend → Mixed Trend
X2M 0.00%
Technology
Strong Downtrend → Mixed Trend
C79 0.35%
Technology
Strong Uptrend → Mixed Trend
CGS 0.00%
Healthcare
Strong Uptrend → Mixed Trend
CNI 0.22%
Real Estate
Strong Uptrend → Mixed Trend
CQR 0.45%
Real Estate
Strong Uptrend → Mixed Trend
FLC 0.00%
Industrials
Strong Uptrend → Mixed Trend
HVN 1.19%
Consumer Cyclical
Strong Uptrend → Mixed Trend
IGL 0.06%
Communication Services
Strong Uptrend → Mixed Trend
LGI 0.00%
Utilities
Strong Uptrend → Mixed Trend
AAL 0.00%
Industrials
Mixed Trend → Strong Downtrend
BPT 4.42%
Energy
Mixed Trend → Strong Downtrend
CTD 9.81%
Consumer Cyclical
Mixed Trend → Strong Downtrend
DXS 2.25%
Real Estate
Mixed Trend → Strong Downtrend
EVT 0.85%
Communication Services
Mixed Trend → Strong Downtrend
EZZ 0.00%
Healthcare
Mixed Trend → Strong Downtrend
KAR 7.03%
Energy
Mixed Trend → Strong Downtrend
MPL 0.82%
Financial Services
Mixed Trend → Strong Downtrend
MTS 1.87%
Consumer Defensive
Mixed Trend → Strong Downtrend
NHF 1.02%
Financial Services
Mixed Trend → Strong Downtrend
RMC 0.00%
Financial Services
Mixed Trend → Strong Downtrend
STO 0.33%
Energy
Mixed Trend → Strong Downtrend
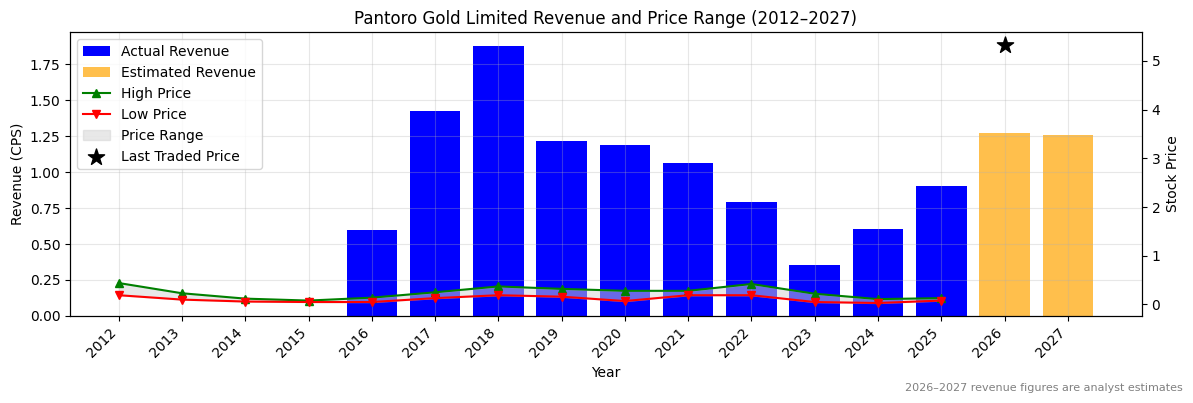
Ticker code: PNR
PNR Red Flags & Risk Indicators⚠️
⚠️ RED FLAGS: 2 identified
Large Share Issuance
High Relative Valuation
Income Statement
Revenue 2024 Per Share
Revenue 2025e Per Share
Revenue 2026e Per Share
Revenue 24 to 25e [%]
Revenue 25e to 26e [%]
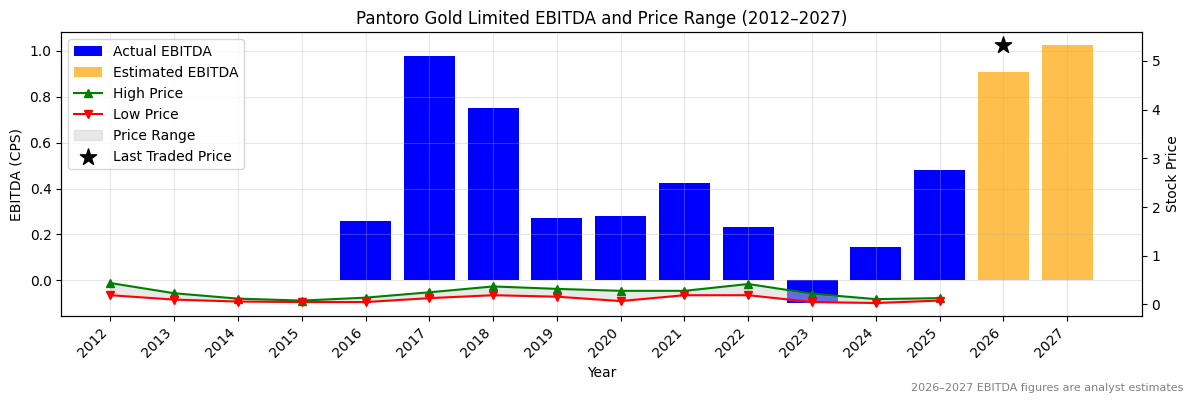
EBITDA 2024 Per Share
EBITDA 2025e Per Share
EBITDA 2026e Per Share
EBITDA 24 to 25e [%]
EBITDA 25e to 26e [%]
0.6044
0.90686
1.27061
50.0 40.1 0.14613
0.48215
0.90991
230.0 88.7
PNR Revenue Per Share (2012–2027)✅✅
PNR Earnings before Interest, Tax, Depreciation and Amortisation (EBITDA) Per Share (2012–2027)✅✅
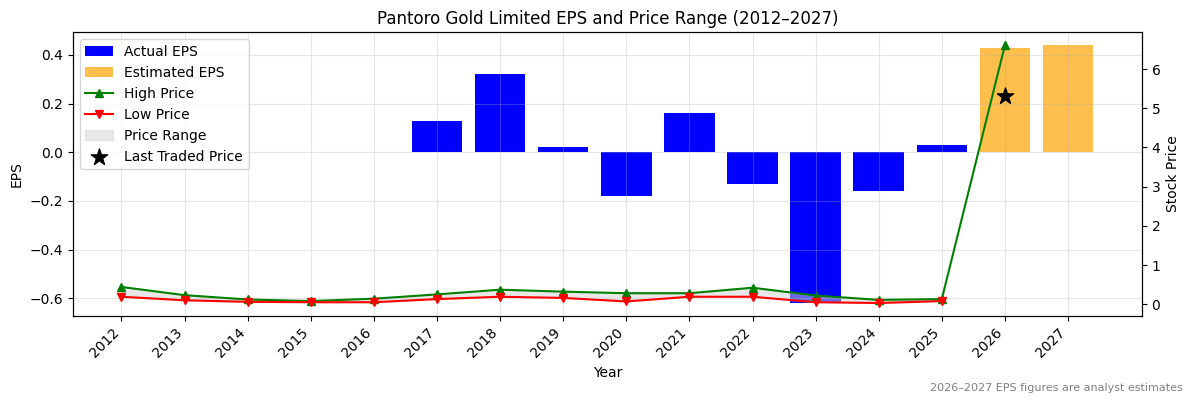
PNR Normalised Earnings Per Share (EPS) (2012–2027)✅✅
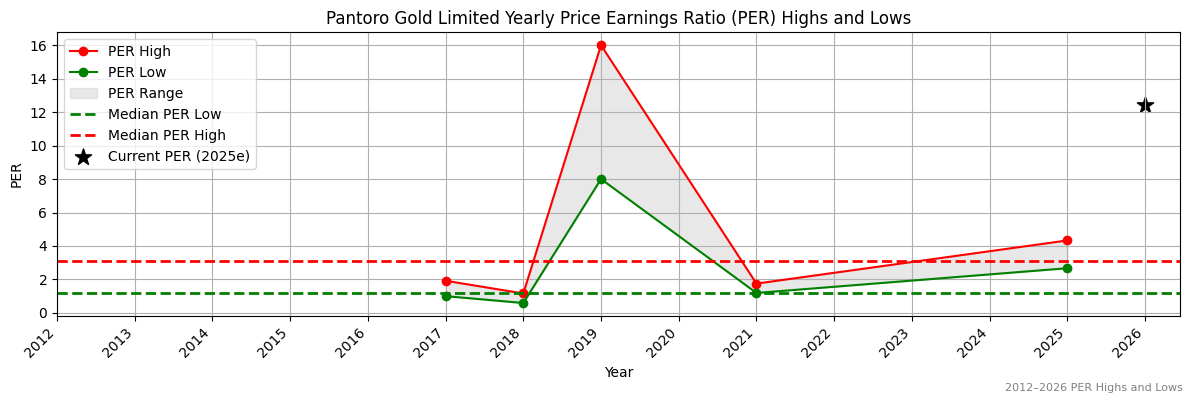
Valuation
Price To Sales
Price To Book
PER 2023
PER 2024
13Y Median PER Low
PER 2025e
13Y Median PER High
PER 2026e
Last Updated
5.6
3.9
-8.3
-32.0
1.2
170.7
3.1
11.9
4/10/25
PNR Yearly Price Earnings Ratio (PER) Highs and Lows❌
PNR Weekly Price Chart with Average True Range (ATR) Trailing Stop (10-Year View)
Pantoro Limited is a gold exploration and production company, operating the Halls Creek Project in Western Australia and the Norseman Gold Project in a joint venture, focusing on developing high-grade gold assets.
Ticker code: PNR
Market Information
Market Capitalisation
Enterprise Value
Shares Outstanding
Free Float [%]
Free Float Value
$2,124,635,036
$2,051,343,772
394180907
74.51
$1,583,108,056
Balance Sheet & Quality
Equity
Cash
Debt
Return On Equity (ROE)
EBITDA 25 Margin [%]
Net Debt / Equity [%]
Rule of 40
$511,252,676
$151,645,968
$78,354,704
2.3
53.2 -14.3 74.2
Technicals & Short Data
3EMA Status
Volatility [%]
Value Traded Today
Average Daily Liquidity
Short [%]
Days To Cover
Partial 5.6
$6,882,340
$13,633,385
0.0
0.0
Dividends
Previous Dividend
Last Dividend
Franking [%]
Ex-Div Date
Gross Yield [%]
None
None
None
None
0.0
Price Performance Snapshot
Last Traded Price
Change [%]
1 Week [%]
1 Month [%]
3 Months [%]
6 Months [%]
12 Months [%]
$5.390 5.5 12.3 5.3 10.0 53.1 217.1
PNR Price Chart with Volume and 3EMA
PNR Short Positions
HERE to understand why the above moving averages have been chosen.
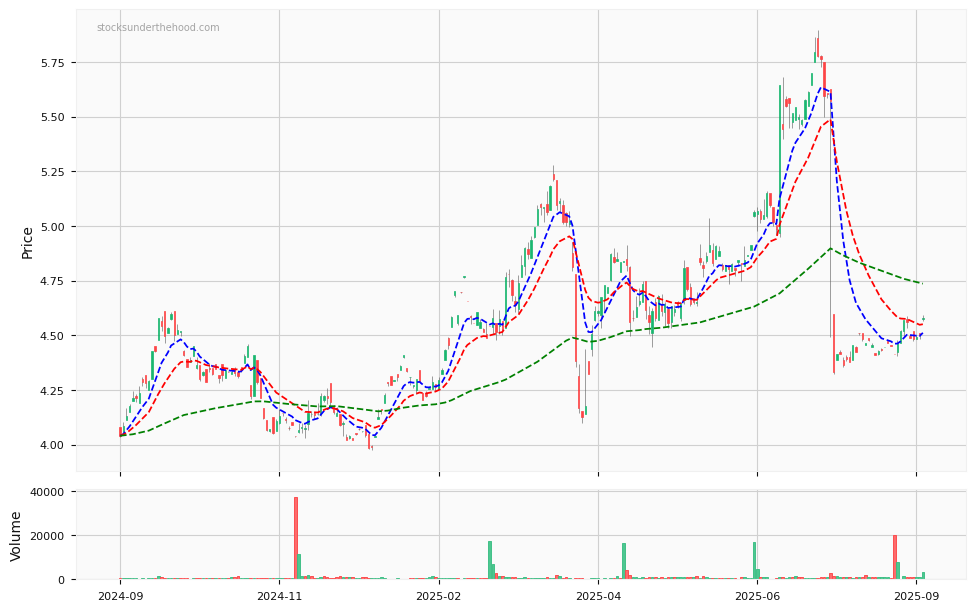
WIRE is the ticker symbol for the Invesco S&P SmallCap Industrials ETF, focusing on small-cap industrial companies.
Ticker code: ASX:WIRE
Sector: Basic Materials | Industry: Copper | Website: N/A
Market Information
Market Capitalisation
Enterprise Value
Shares Outstanding
Free Float [%]
Free Float Value
None
None
None
0.0
#VALUE!
Balance Sheet & Quality
Equity
Cash
Debt
Return On Equity (ROE)
EBITDA 24 Margin [%]
Net Debt / Equity [%]
Rule of 40
None
None
None
None
None
0.0
None
Technicals & Short Data
3EMA Status
Volatility [%]
Value Traded Today
Average Daily Liquidity
Short [%]
Days To Cover
Positive None
$11,601,926
$19,375,318
0.0
0.0
Dividends
Previous Dividend
Last Dividend
Franking [%]
Ex-Div Date
Gross Yield [%]
None
None
None
None
None
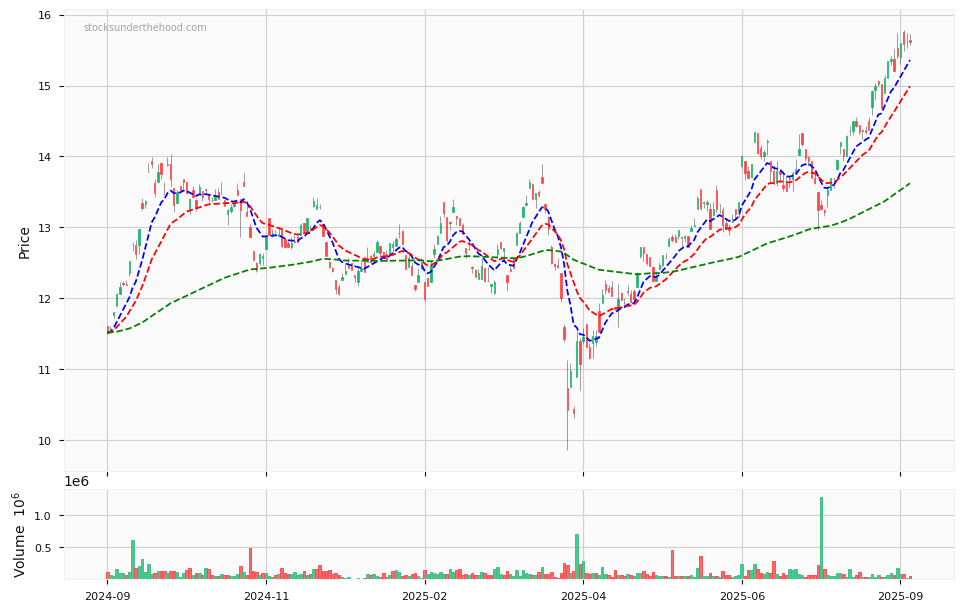
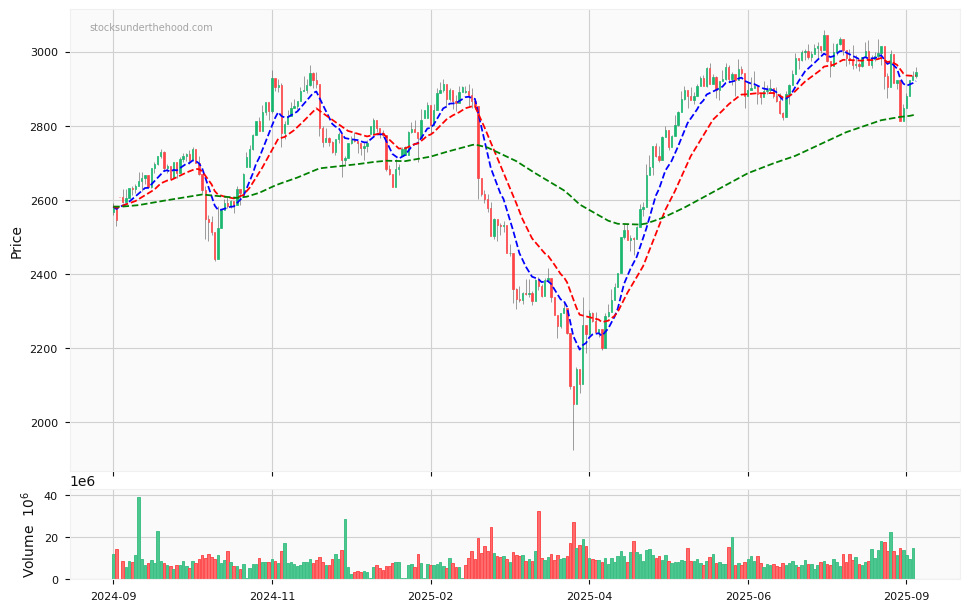
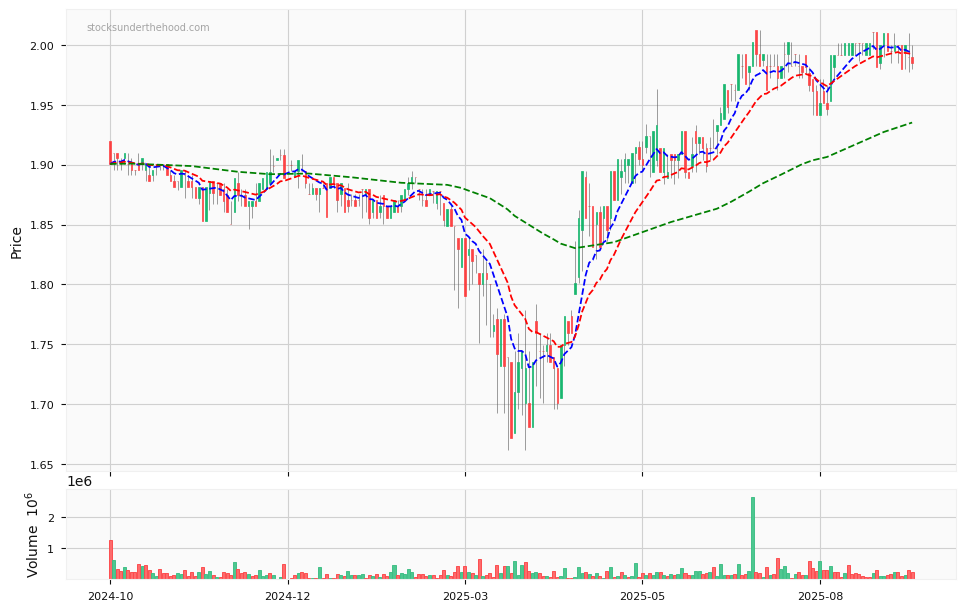
ASX:WIRE Price Chart with Volume and 3EMA
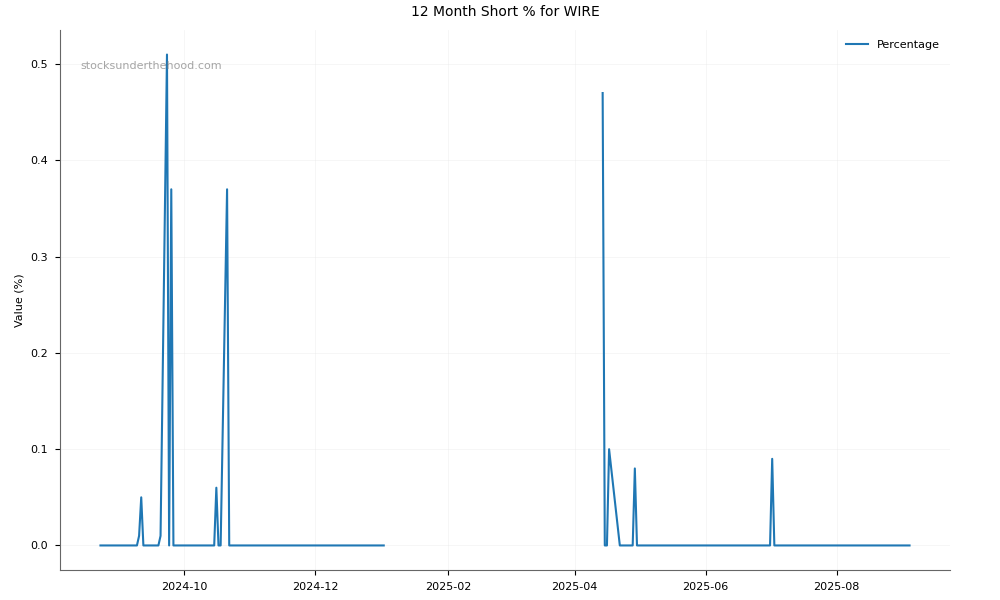
ASX:WIRE Short Positions
HERE to understand why the above moving averages have been chosen.
Crude oil futures are contracts agreeing to buy or sell oil at a future date, serving as a benchmark for oil prices.
Ticker code: CL=F
Market Information
Market Capitalisation
Enterprise Value
Shares Outstanding
Free Float [%]
Free Float Value
None
None
None
0.0
#VALUE!
Balance Sheet & Quality
Equity
Cash
Debt
Return On Equity (ROE)
EBITDA 24 Margin [%]
Net Debt / Equity [%]
Rule of 40
None
None
None
None
None
0.0
None
Technicals & Short Data
3EMA Status
Volatility [%]
Value Traded Today
Average Daily Liquidity
Short [%]
Days To Cover
None None
$97,796
$5,197
None
0.0
Dividends
Previous Dividend
Last Dividend
Franking [%]
Ex-Div Date
Gross Yield [%]
None
None
None
None
None
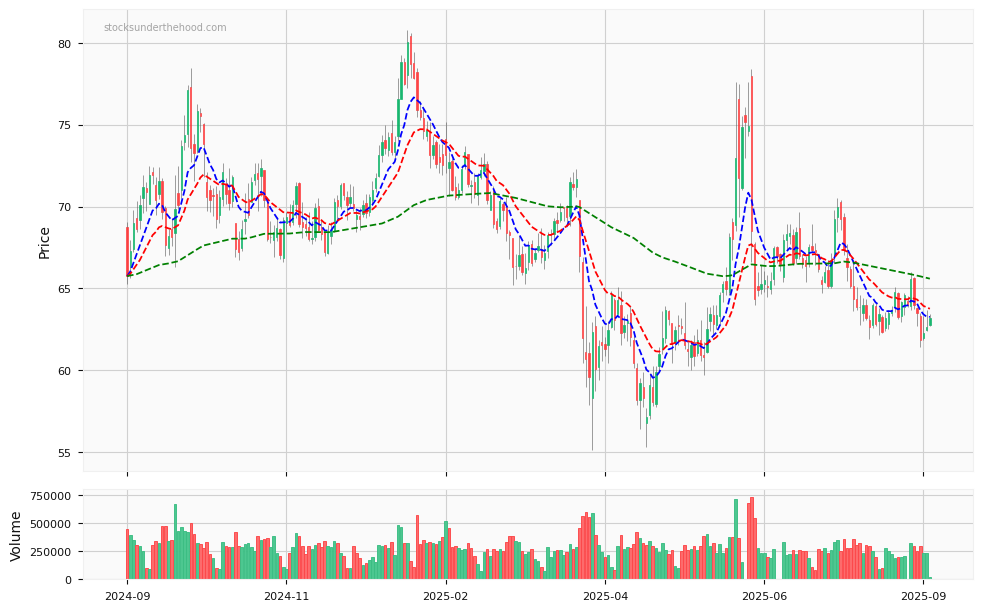
CL=F Price Chart with Volume and 3EMA
CL=F Short Positions
No chart available for this company.
HERE to understand why the above moving averages have been chosen.
Copper futures are contracts specifying the delivery of copper at a future date and are used to hedge against price fluctuations.
Ticker code: HG=F
Market Information
Market Capitalisation
Enterprise Value
Shares Outstanding
Free Float [%]
Free Float Value
None
None
None
0.0
#VALUE!
Balance Sheet & Quality
Equity
Cash
Debt
Return On Equity (ROE)
EBITDA 24 Margin [%]
Net Debt / Equity [%]
Rule of 40
None
None
None
None
None
0.0
None
Technicals & Short Data
3EMA Status
Volatility [%]
Value Traded Today
Average Daily Liquidity
Short [%]
Days To Cover
None None
$1,994,517
$34,514
None
0.0
Dividends
Previous Dividend
Last Dividend
Franking [%]
Ex-Div Date
Gross Yield [%]
None
None
None
None
None
HG=F Price Chart with Volume and 3EMA
HG=F Short Positions
No chart available for this company.
HERE to understand why the above moving averages have been chosen.
Ticker code: ASX:WIRE
ASX:WIRE Red Flags & Risk Indicators✅
⚠️ RED FLAGS: 0 identified
No red flags detected.
Income Statement
Revenue 2024 Per Share
Revenue 2025e Per Share
Revenue 2026e Per Share
Revenue 24 to 25e [%]
Revenue 25e to 26e [%]
EBITDA 2024 Per Share
EBITDA 2025e Per Share
EBITDA 2026e Per Share
EBITDA 24 to 25e [%]
EBITDA 25e to 26e [%]
None
None
None
None
None
None
None
None
None
None
ASX:WIRE Revenue Per Share (2012–2027)
ASX:WIRE Earnings before Interest, Tax, Depreciation and Amortisation (EBITDA) Per Share (2012–2027)
ASX:WIRE Normalised Earnings Per Share (EPS) (2012–2027)
Valuation
Price To Sales
Price To Book
PER 2023
PER 2024
13Y Median PER Low
PER 2025e
13Y Median PER High
PER 2026e
Last Updated
None
None
None
None
None
None
None
None
None
ASX:WIRE Yearly Price Earnings Ratio (PER) Highs and Lows
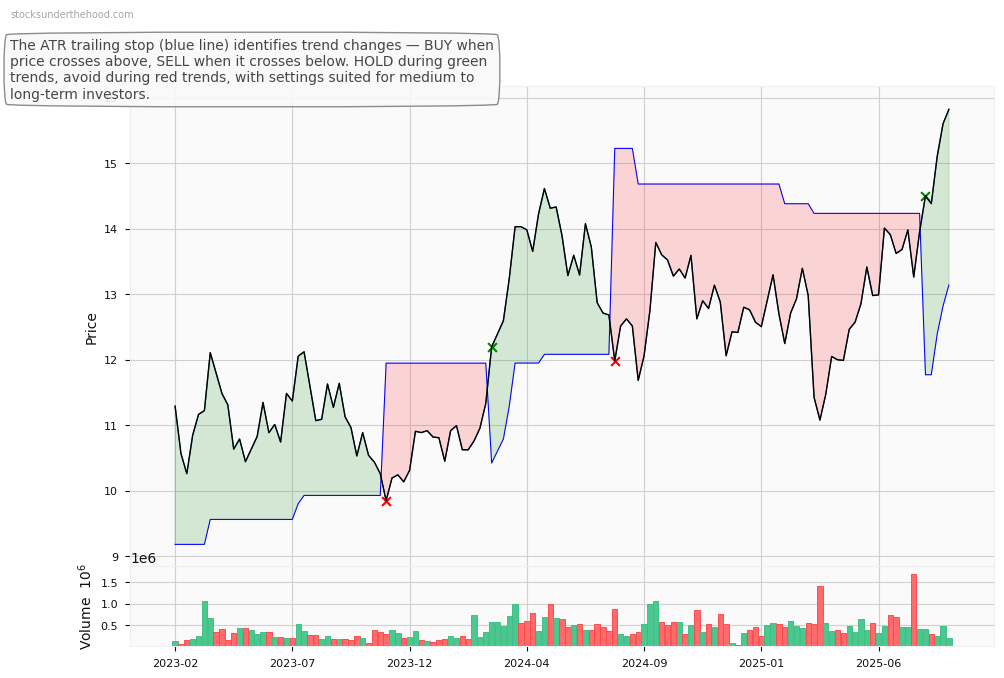
ASX:WIRE Weekly Price Chart with Average True Range (ATR) Trailing Stop (10-Year View)
![S&P/ASX 200 Communication [XTJ] (^AXTJ) Revenue Chart 2012–2027](https://stocksunderthehood.com/charts/^AXTJ_revenue_chart.png)
![S&P/ASX 200 Communication [XTJ] (^AXTJ) EBITDA Chart 2012–2027](https://stocksunderthehood.com/charts/^AXTJ_ebitda_chart.png)
![S&P/ASX 200 Communication [XTJ] (^AXTJ) Normalised EPS Chart (2012–2027)](https://stocksunderthehood.com/charts/^AXTJ_eps_chart.png)
![S&P/ASX 200 Communication [XTJ] (^AXTJ) PER Highs and Lows (2012–2027)](https://stocksunderthehood.com/charts/^AXTJ_per_chart.png)
![S&P/ASX 200 Communication [XTJ] (^AXTJ) 10-Year Weekly ATR Trailing Stop Price Chart](https://stocksunderthehood.com/charts/^AXTJ_atr.png)
![S&P/ASX 200 Info Tech [XIJ] (^AXIJ) Revenue Chart 2012–2027](https://stocksunderthehood.com/charts/^AXIJ_revenue_chart.png)
![S&P/ASX 200 Info Tech [XIJ] (^AXIJ) EBITDA Chart 2012–2027](https://stocksunderthehood.com/charts/^AXIJ_ebitda_chart.png)
![S&P/ASX 200 Info Tech [XIJ] (^AXIJ) Normalised EPS Chart (2012–2027)](https://stocksunderthehood.com/charts/^AXIJ_eps_chart.png)
![S&P/ASX 200 Info Tech [XIJ] (^AXIJ) PER Highs and Lows (2012–2027)](https://stocksunderthehood.com/charts/^AXIJ_per_chart.png)
![S&P/ASX 200 Info Tech [XIJ] (^AXIJ) 10-Year Weekly ATR Trailing Stop Price Chart](https://stocksunderthehood.com/charts/^AXIJ_atr.png)
![Candle share price chart for S&P/ASX 200 Communication [XTJ] (^AXTJ) over the past 12 months, accompanied by trading volume bars and 3EMA moving averages.](https://stocksunderthehood.com/charts/^AXTJ.png)