This is a restricted members post.
Author: Nathan
ASX Volume Spikes
Date: 01-12-2025 19:34:08 | This table shows the companies that have traded with at least two-times their usual daily volume today.
| Volume Spike | Ticker | Name | Sector | Change % |
|---|---|---|---|---|
| 303.9 | SI=F | USD Silver Price | Basic Materials | 0.00% |
| 100.9 | GC=F | USD Gold Price | Basic Materials | 0.00% |
| 34.2 | HG=F | USD Copper Price | Basic Materials | 0.00% |
| 14.2 | WAF | West African Resources Limited | Basic Materials | 3.69% |
| 11.4 | IFM | Infomedia Ltd | Technology | 0.00% |
| 6.4 | LGL | Lynch Group Holdings Limited | Consumer Defensive | 0.00% |
| 6.2 | NSR | National Storage REIT | Real Estate | 1.12% |
| 4.2 | VSL | Vulcan Steel Limited | Basic Materials | 1.40% |
| 4.0 | VEE | VEEM Ltd | Industrials | -25.54% |
| 3.9 | EML | EML Payments Limited | Technology | 1.79% |
| 3.8 | VGL | Vista Group International Limited | Technology | 0.00% |
| 3.6 | TOT | 360 Capital REIT | Real Estate | 1.23% |
| 3.4 | BMT | Beamtree Holdings Limited | Healthcare | 10.00% |
| 3.3 | ABY | Adore Beauty Group Limited | Consumer Cyclical | 4.51% |
| 3.1 | DUB | Dubber Corporation Limited | Technology | 6.67% |
| 3.1 | EXR | Elixir Energy Limited | Energy | 10.53% |
| 3.1 | TPW | Temple & Webster Group Ltd | Consumer Cyclical | 7.40% |
| 3.0 | WEB | Web Travel Group Limited | Consumer Cyclical | 4.15% |
| 3.0 | IPG | IPD Group Limited | Industrials | 1.32% |
| 2.9 | LBL | LaserBond Limited | Industrials | 6.56% |
| 2.8 | EZZ | EZZ Life Science Holdings Limited | Healthcare | -8.60% |
| 2.7 | RKT | RocketDNA Ltd. | Technology | 11.76% |
| 2.6 | SEQ | Sequoia Financial Group Limited | Financial Services | 0.00% |
| 2.6 | ONE | Oneview Healthcare PLC | Healthcare | 0.00% |
| 2.6 | SRL | Sunrise Energy Metals Limited | Industrials | 7.29% |
| 2.6 | BPT | Beach Energy Limited | Energy | -1.26% |
| 2.6 | VEA | Viva Energy Group Limited | Energy | 1.44% |
| 2.5 | MEZ | Meridian Energy Limited | Utilities | 0.40% |
| 2.5 | VNT | Ventia Services Group Limited | Industrials | 0.17% |
| 2.5 | FLT | Flight Centre Travel Group Limited | Consumer Cyclical | 6.54% |
| 2.4 | SYL | Symal Group Limited | Industrials | 7.36% |
| 2.3 | MTS | Metcash Limited | Consumer Defensive | -1.33% |
| 2.3 | IMM | Immutep Limited | Healthcare | 7.02% |
| 2.3 | EZL | Euroz Hartleys Group Limited | Financial Services | -0.48% |
| 2.3 | BIO | Biome Australia Limited | Consumer Defensive | 6.02% |
| 2.1 | SKO | Serko Limited | Technology | 4.42% |
| 2.0 | EHL | Emeco Holdings Limited | Industrials | 2.99% |
| 2.0 | HIT | HiTech Group Australia Limited | Industrials | -1.80% |
Dalrymple Bay Infrastructure (ASX:DBI) Analysis
https://dbinfrastructure.com.au/
About the company
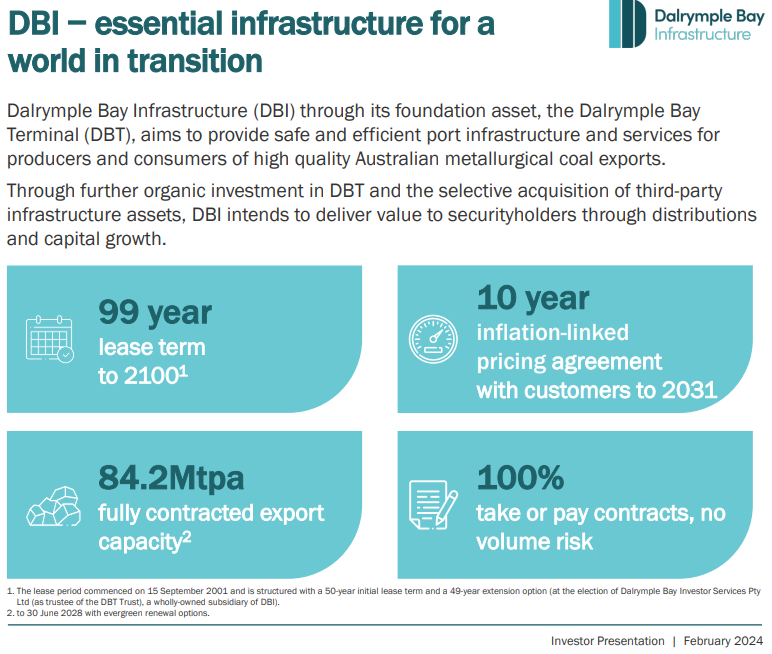
Dalrymple Bay Infrastructure Ltd. (DBI) is an Australian company that owns and operates the Dalrymple Bay Coal Terminal (DBCT) in Queensland, one of the world’s largest coal export facilities. Here are some key points about the company:
- Core Business: DBI’s primary asset is the Dalrymple Bay Coal Terminal, which handles, stores, and ships coal from the Bowen Basin coalfields to global markets. This terminal is critical for the export of metallurgical coal, which is used in steel production.
- Operations: The terminal has a significant capacity, capable of handling over 85 million tonnes of coal per annum. It operates under a long-term lease from the Queensland Government and provides services to multiple coal producers.
- Revenue Model: DBI generates revenue through user agreements with coal producers, who pay fees for the handling and shipping of coal. These agreements typically involve long-term contracts, providing DBI with stable and predictable cash flows.
- Financial Performance: DBI’s financial performance is closely tied to coal export volumes and global coal demand. The company benefits from the demand for high-quality metallurgical coal, particularly from Asian markets.
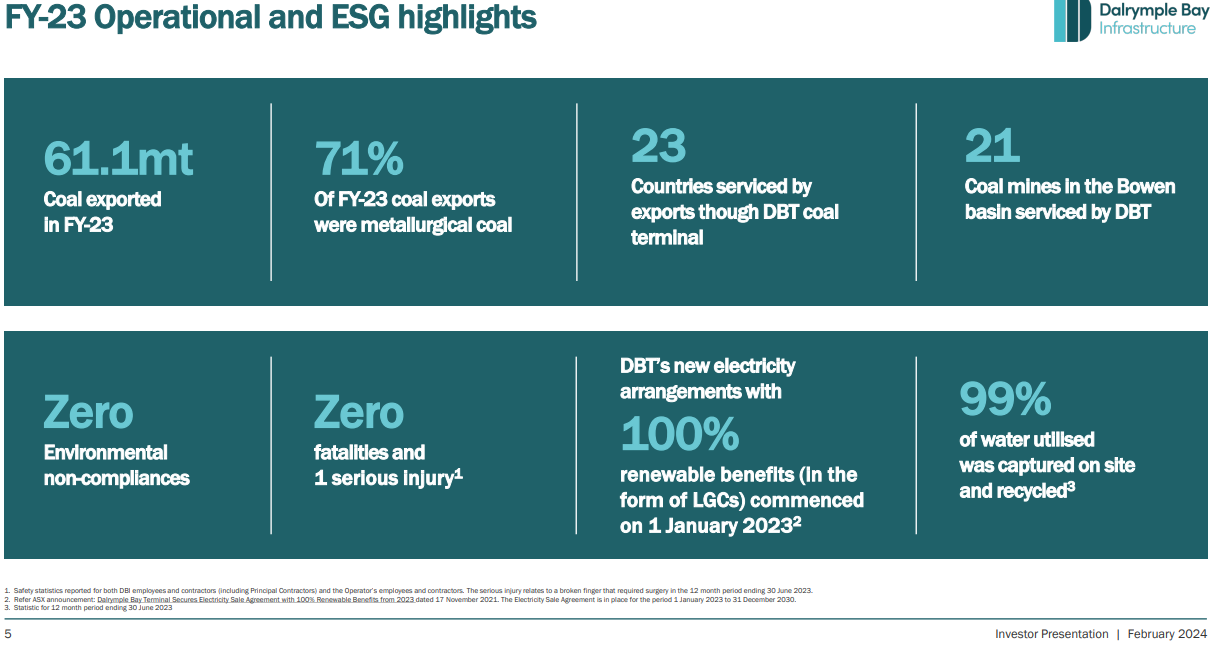
- Growth Potential: DBI focuses on optimizing and expanding terminal operations to increase capacity and efficiency. This includes investment in infrastructure and technology to support growing coal export volumes.
- Sustainability: DBI is committed to sustainable practices and adheres to environmental regulations. The company engages with stakeholders to ensure responsible and sustainable operations, considering the environmental impact of coal handling and shipping.
Initial Screening
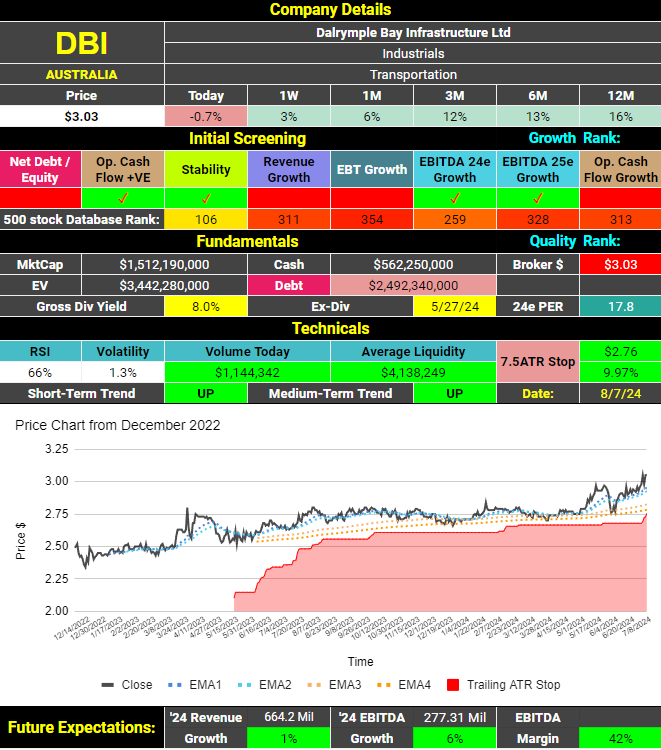
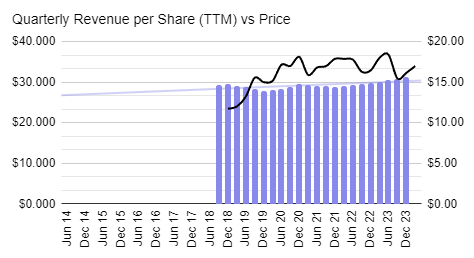
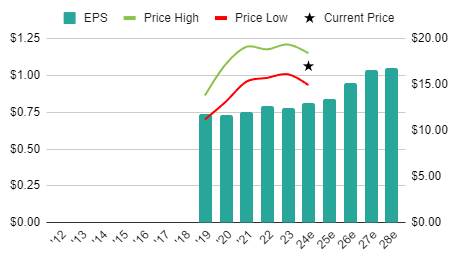
Dalrymple Bay Infrastructure (ASX:DBI) has a healthy grossed up dividend yield of 8% and an undemanding price earnings ratio (PER) of 17.8. Brokers see further growth in their revenues and earnings when they next report their results.
Fundamental analysis
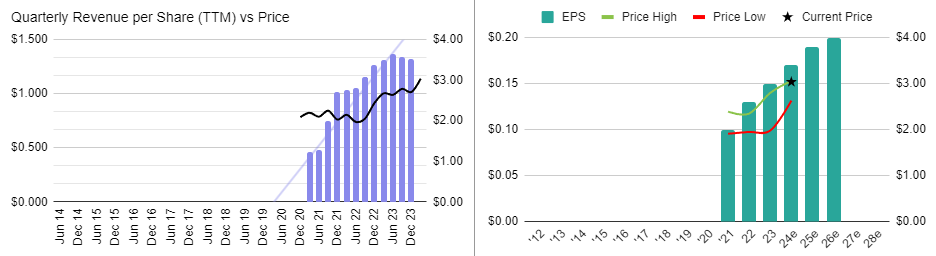
Dalrymple Bay Infrastructure (ASX:DBI) has been a strong performer in the short time it has been listed with brokers seeing no reason why that won’t continue.
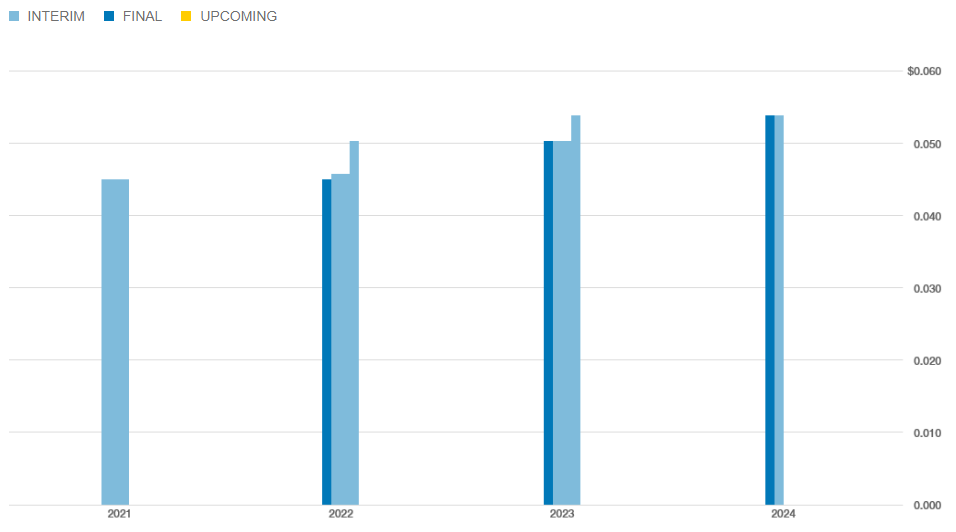
Dividends have been increasing steadily since listing.
Dalrymple Bay Infrastructure (ASX:DBI) is #619 on the ASX list of most shorted stocks. Short positions in this company are inconsequential.
Quality Analysis
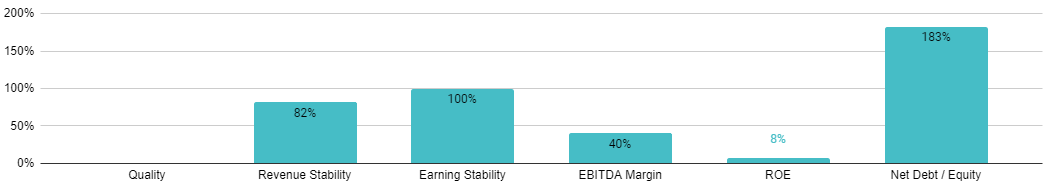
It’s still relatively early days as a listed company, but the signs are positive. Earnings and revenues have been steadily rising while margins are strong. Less positive is the fact the company does have a significant debt position and a modest return on equity. I would rate this a medium quality company.
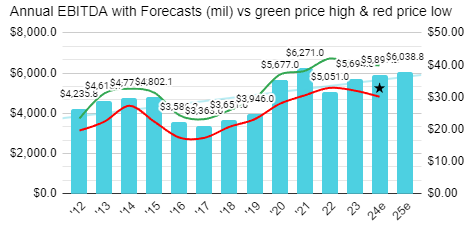
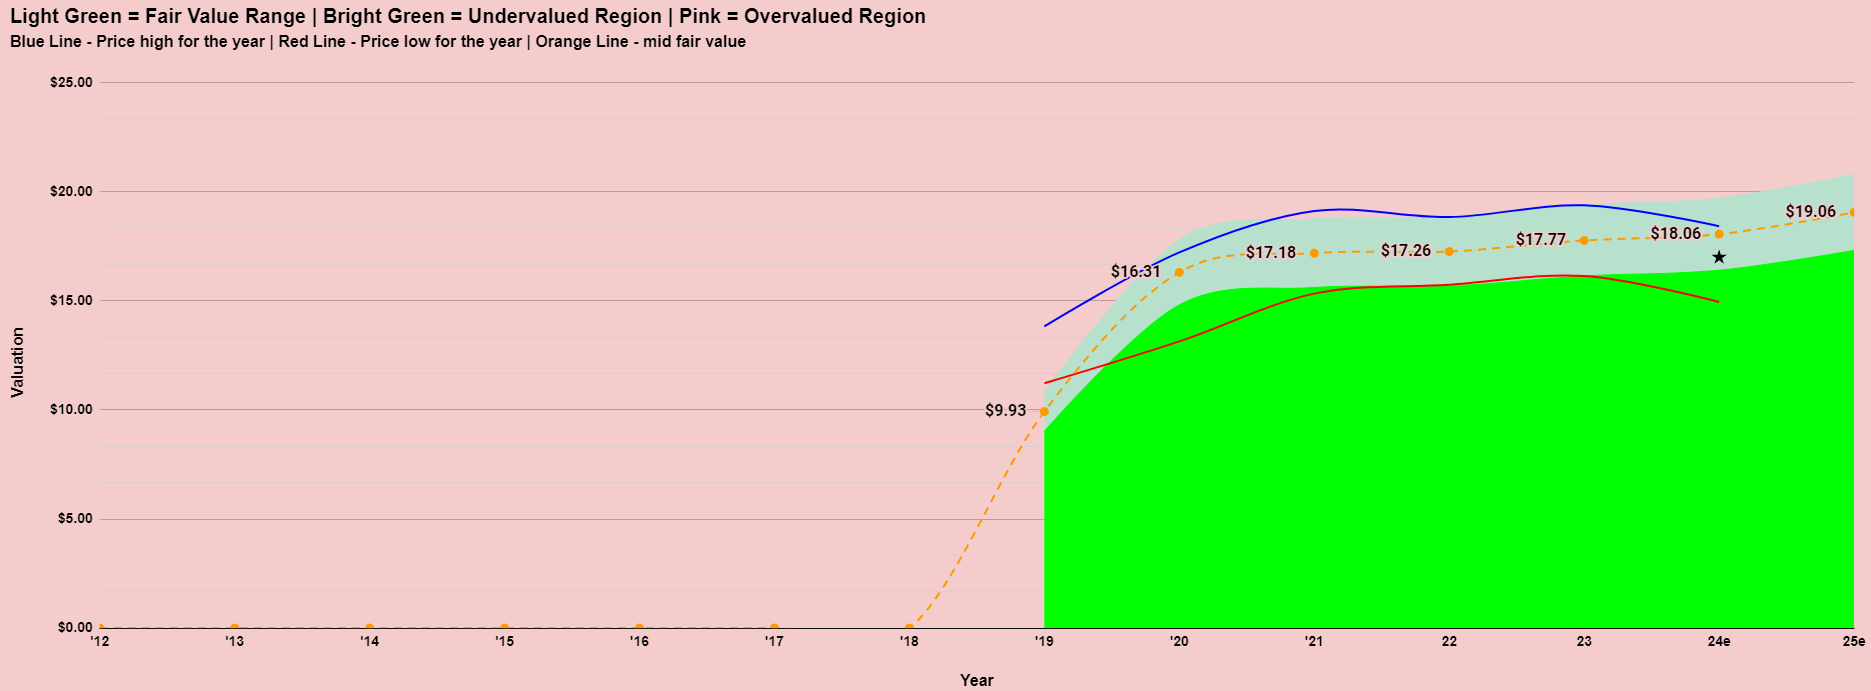
Valuation
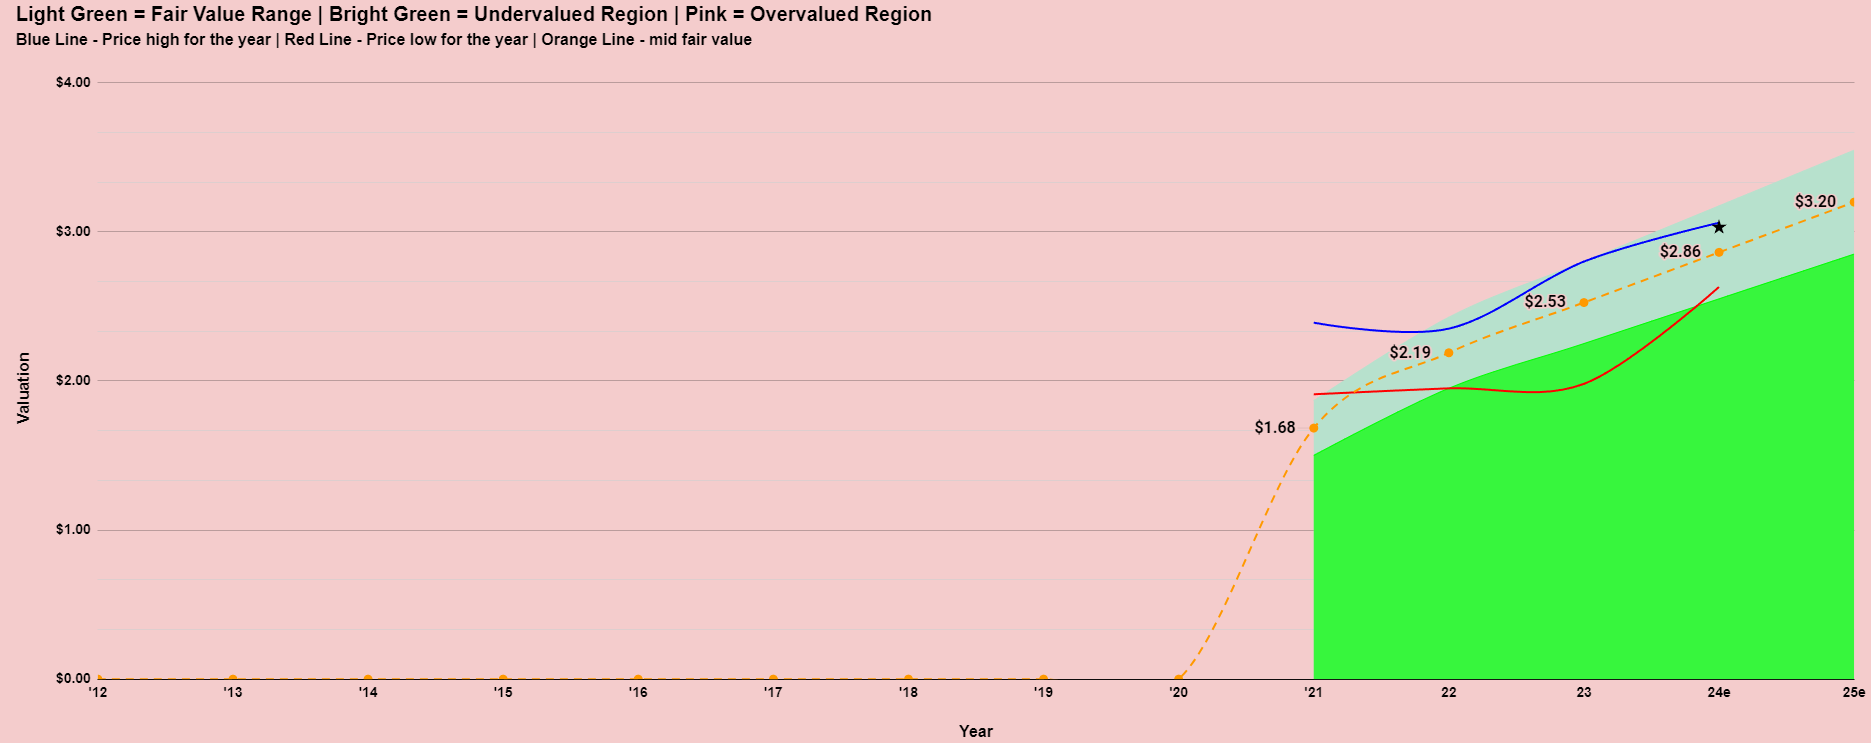
There isn’t a lot of history for the valuation model but the company doesn’t appear to be particularly cheap or expensive. A grossed up yield of around 8% is no doubt attractive to the dividend investor though.
News From The Company
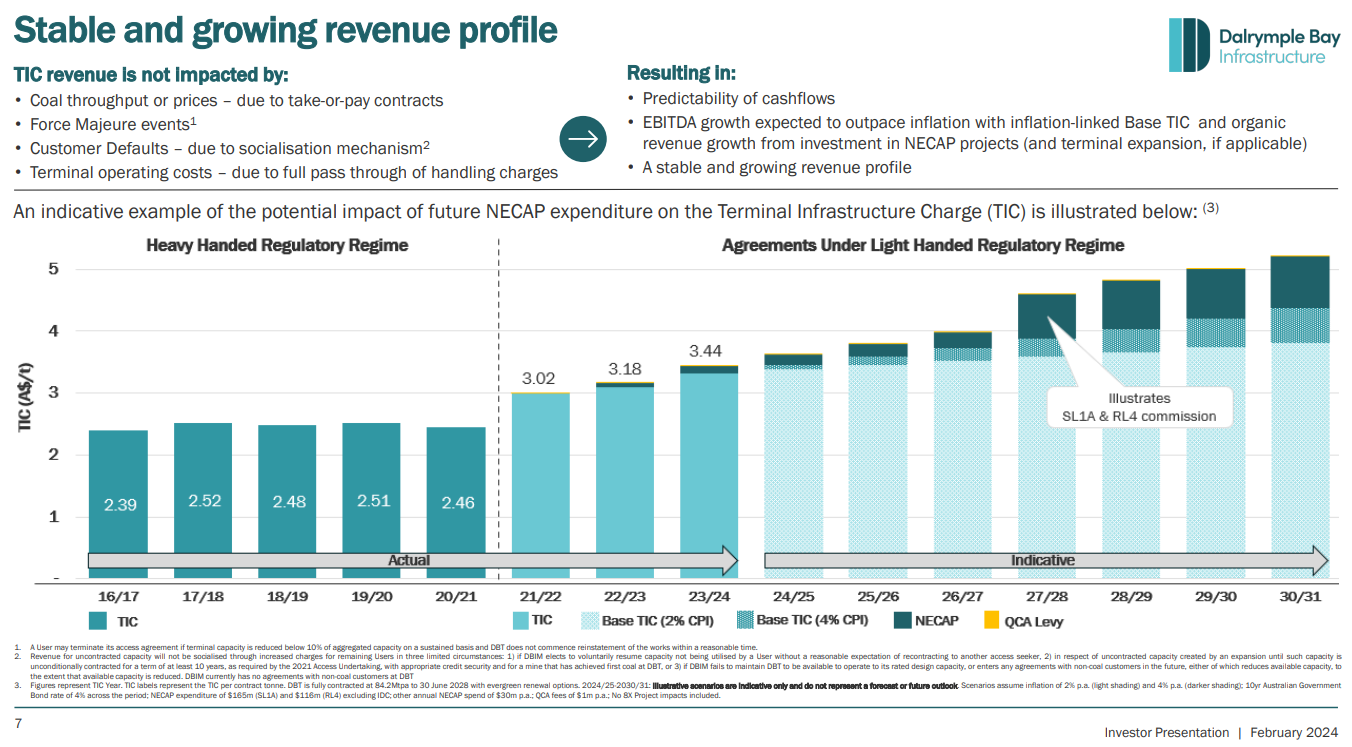
Incidentally, “TIC” stands for Terminal Infrastructure Charge. This charge is a core revenue component for DBI, representing the fees paid by customers for the use of the Dalrymple Bay Coal Terminal’s infrastructure. The Terminal Infrastructure Charge is a significant element of DBI’s income, supporting the maintenance and operation of the terminal and contributing to the company’s overall financial performance.
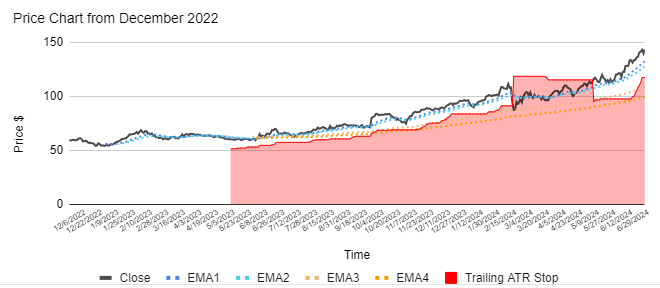
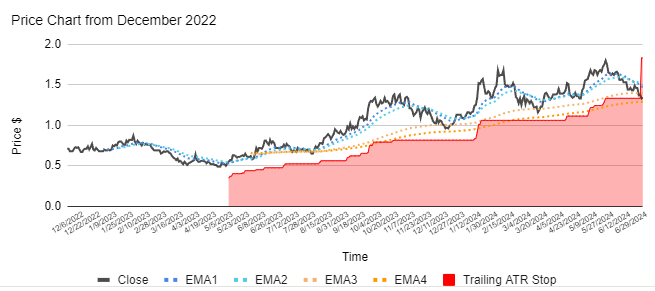
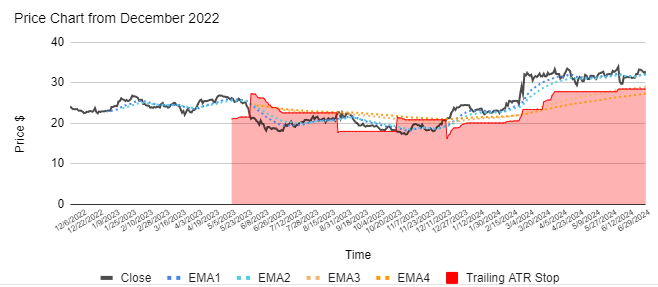
Technical Analysis
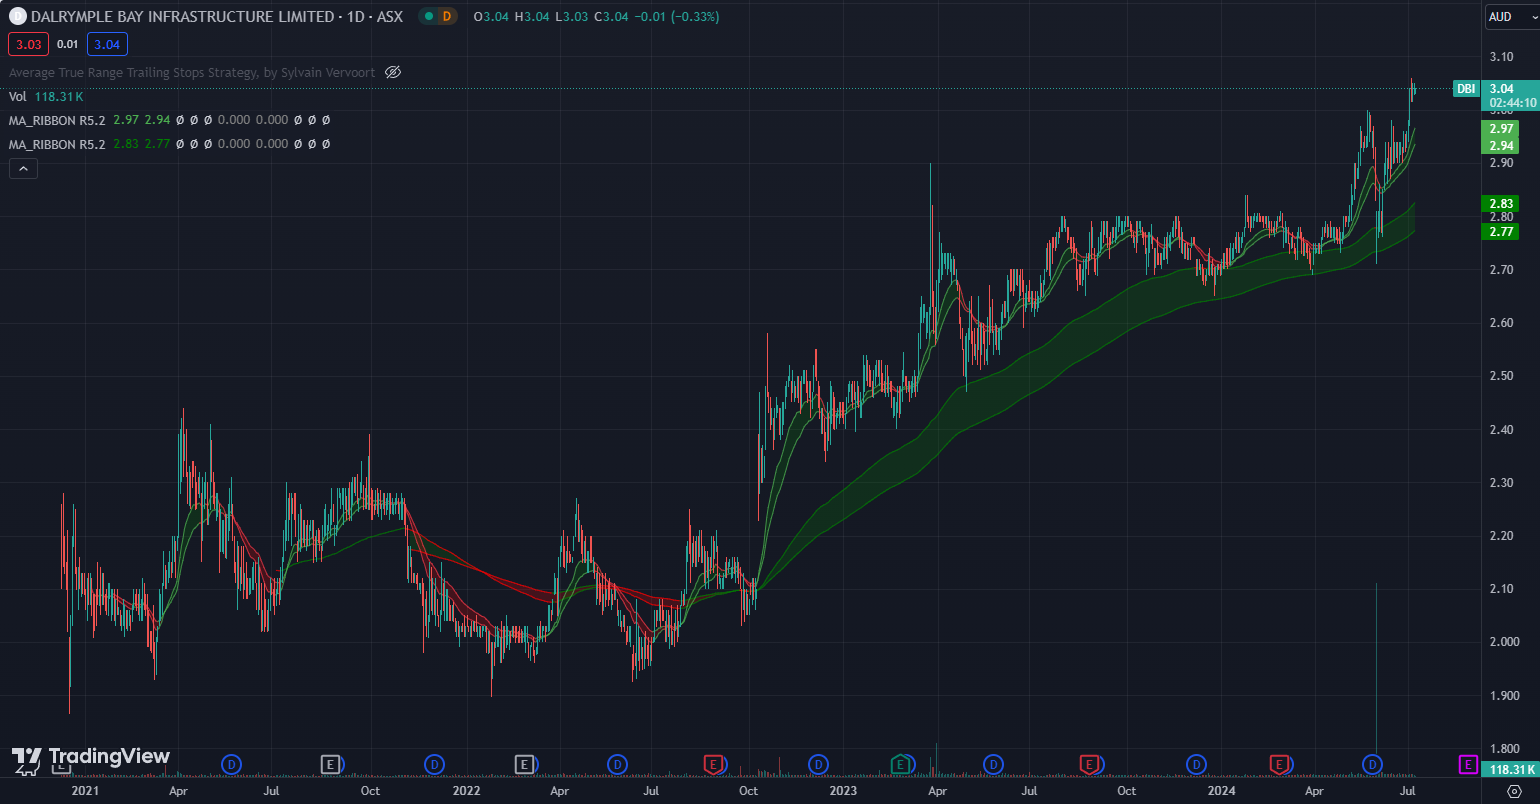
The chart is in a short and medium term uptrend and has been since the price broke out from a sideways patter in October 2022.
Final thoughts on Dalrymple Bay Infrastructure (ASX:DBI)
Dalrymple Bay Infrastructure (ASX: DBI) is highlighted as a compelling dividend stock due to its stable revenue from long-term user agreements at its coal terminal. Despite high debt, the company’s consistent cash flow supports a robust dividend yield, making it attractive for income-focused investors. Analysts appreciate DBI’s potential for reliable dividend returns, backed by steady demand for coal exports and strategic infrastructure investments.
ABOUT STOCKS UNDER THE HOOD
If you’re an active investor or would like to become one, Stocks Under The Hood is your ideal companion. I provide a wealth of educational resources, including detailed company dashboards, in-depth reports, and model portfolios. My goal is to help you cut through market noise with clear, actionable insights and educational content, empowering you to make informed investment decisions. With a strategic, growth-focused approach, I guide you toward the best opportunities in the market.
A FREE 14 Day TRIAL is available enabling you full access to the site (just provide your name and email address – no credit card is required). You will then be able to view all of the Stock Reports, Company Dashboards, and two Model Portfolios. ALSO, request ONE STOCK OF YOUR CHOICE from the Australian or US market and I will do a full stock report for you.

Disclaimer: This information is provided purely for educational purposes. It takes no account of an individual’s personal financial circumstances and hence can in no way constitute financial advice. The above data may be subject to errors or inconsistencies for which the author takes no liability. It is imperative that all investors do their own research or if they need advice, seek it from a qualified financial adviser.
Aristocrat Leisure (ASX:ALL) Analysis
This is a restricted members post.
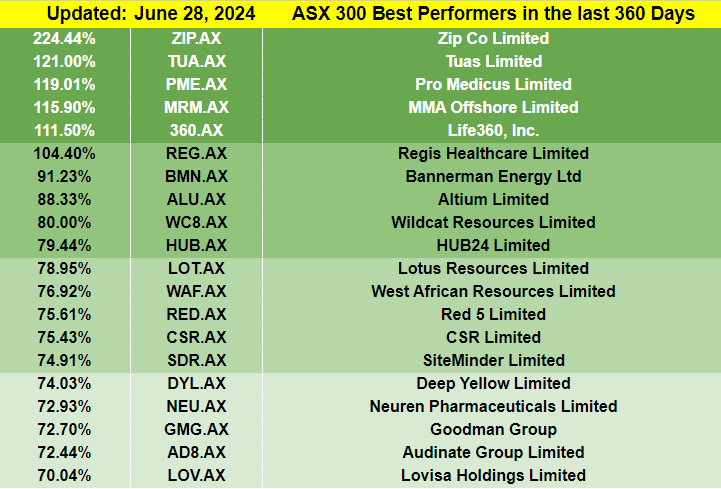
20 Biggest Winners of FY2024
As the 2024 Financial year is now closed, I want to take a look at the top 20 Biggest Winners of FY2024 in the ASX 300 and see if there is anything that can be learned from them. Specifically I’m looking to see if they are profitable, if they are growing and if so, how fast and lastly their Price Earnings Ratio (PER) to see if there remains any value. I’ll also take a look at their price charts.
1. ZIP Co ASX:ZIP
Revenue expected to grow 22% this year and EBITDA to turn positive for the first time. FY24e PER 141.
2. Tuas ASX:TUA
Revenue expected to grow 29% and EBITDA 41%. FY24e PER n/a (not expected to be profitable this year).
3. Pro Medicus ASX:PME
Revenue to grow 30% this year and EBITDA 29%. FY24e PER 188.

4. MMA Offshore ASX:MRM
Under takeover with Revenue to grow 37% and EBTIDA 96% this year. FY24e PER 14. Looks like the acquirer is picking up a bargain!
5.Life360 ASX:360
Revenue up 21% and EBITDA 60% this year. FY24e PER 82.
6.Regis Healthcare ASX:REG
Revenue up 14% and EBTDA 28% is the forecast for this year. FY24e PER 36.
7.Bannerman Energy ASX:BMN
Uranium explorer with first production expected in 2027 benefitting from a Uranium price that has risen from $56 per pound to $84 in the last 12 months. FY24e PER n/a (not expected to be profitable this year).
8 Altium ASX:ALU
Under takeover with revenue up 14% and EBITDA up 9% predicted for this year. FY24e PER 76.
9. Wildcat Resources ASX:WC8
Gold, lithium, copper and nickel explorer with no revenues anticipated before 2028. FY24e PER n/a.
10. HUB 24 ASX:HUB
This year revenue is expected to grow 19% while EBITDA is expected to improve by 17%. FY24e PER 56.
11. Lotus Resources ASX:LOT
Uranium explorer with first revenues forecast for 2026. FY24e PER n/a (not expected to be profitable this year).
12. West African Resources ASX:WAF
Gold miner with revenue forecast to grow 4% and EBITDA to grow 8%. FY24e PER 11.
13. Red5 ASX:RED
Gold miner with revenue forecast to grow 36% and EBTIDA to grow 90%. They also recently merged with Silver Lake Resources roughly doubling the size of the company as a result. FY24e PER 18.
14. CSR ASX:CSR
Under takeover. Revenues expected to grow 1% and EBITDA by 1%. FY24e PER 18.
15. SiteMinder ASX:SDR
Revenue to grow 27% and EBITDA to turn positive for the first time this year. FY24e PER n/a (not expected to be profitable this year).
16. Deep Yellow ASX:DYL
Uranium explorer with first significant revenues expected in 2026. FY24e PER n/a (not expected to be profitable this year).
17. Neuren Pharmaceuticals ASX:NEU
Revenues and EBTIDA are predicted to fall this year after a breakout year last year. Growth is predicted to return in 2025. FY24e PER 30.
18. Goodman Group ASX:GMG
Revenues and EBTIDA forecast to grow 15% and 16% respectively in 2024. FY24e PER 33.
19. Audinate ASX:AD8
Revenues to grow 34% and EBITDA 78% this year. FY24e PER 144.
20. Lovisa ASX:LOV
Revenues to grow 20% and EBITDA 88% this year. FY24e PER 43.
Final thoughts on the 20 Biggest Winners of FY2024
Most of the stocks on this list are supported by strong revenue and earnings growth. However, when viewed through the lens of the P/E ratio, there doesn’t seem to be much value. Despite this, some of these stocks have consistently been top performers on the ASX for years and rarely appear “cheap.” The saying “cut your losses early and let your winners run” is common in investing. To truly embrace this approach, you must also be comfortable holding stocks that are sometimes significantly overvalued. While many of the stocks mentioned may have room to rise further, some charts clearly show that the trend has now broken down.
All in all, this is an impressive list of companies, a number of which are considered to be the best quality businesses on the Australian Stock Exchange. Some others are being backed to be future stars while a few of the resource companies have benefitted from steep rises in their underlying commodities which may or may not be sustainable.
Post Thought – The best stocks of FY2023
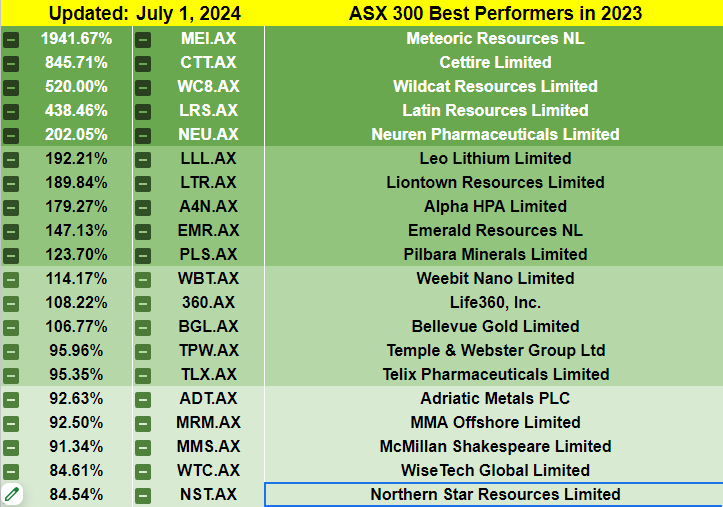
4 of the best stocks of FY2023 are once again among the top 20 best in FY2024. None of the worst stocks of FY2023 appear on the best stock list in FY2024.
Disclaimer: This information is provided purely for educational purposes. It takes no account of an individual’s personal financial circumstances and hence can in no way constitute financial advice. The above data may be subject to errors or inconsistencies for which the author takes no liability. It is imperative that all investors do their own research or if they need advice, seek it from a qualified financial adviser.
20 Biggest Winners of FY2024
20 Biggest Losers of FY2024
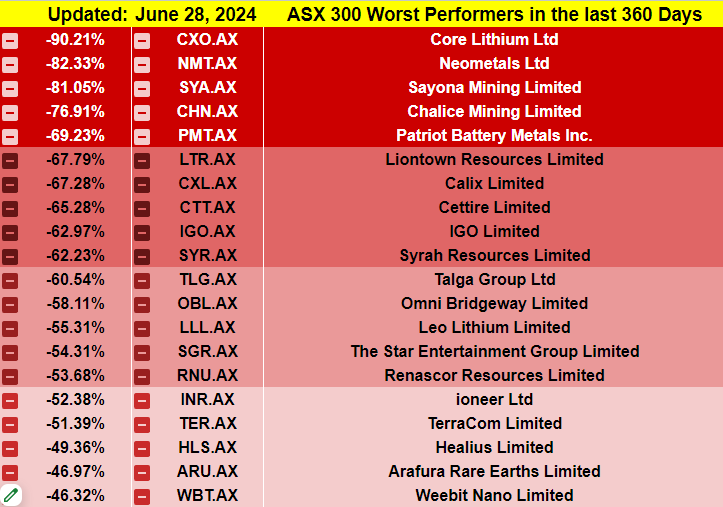
As the 2024 Financial year is now closed, I want to take a look at the top 20 Biggest Losers of FY2024 in the ASX 300 and see if there is anything that can be learned from them.
1. Core Lithium ASX:CXO
As the name suggests, a Lithium stock. First production was in FY2023 they even showed a small profit. In FY2024, production increased but the lithium price has fallen so much that they will make a loss this year. One of the biggest winners during 2021 and 2022 is now the biggest loser of 2024.
2. Neometals ASX:NMT
A battery mineral hopeful that has no revenues and doesn’t look like having any for many years yet.
3. Sayona Mining ASX:SYA
Another Lithium miner with first its first revenues produced this year. Unfortunately, they are not profitable at current Lithium prices and are not forecast to turn a profit until beyond FY2026.
4. Chalice Mining ASX:CHN
Gold, copper, cobalt, palladium, platinum and nickel miner that is nowhere near producing any revenues or profits. Analysts see nothing in this regard until beyond 2028.
5. Patriot Battery Metals ASX:PMT
Lithium explorer with no earnings or revenues forecast until beyond 2028.
6. Liontown Resources ASX:LTR
Lithium miner expected to produce first revenues next year. Analysts are even forecasting a profit. Of course, that will be almost entirely dependent on the lithium price.
7. Calix ASX:CXL
Environmental technology company producing small revenues but not forecast to turn a profit until beyond 2026.
8. Cettire ASX:CTT
Profitable Luxury goods drop-shipper. Profitable until the most recent quarter/half that is. Business model called into question as revenues are set to rise 78% in 2024 and yet profitability now looks unlikely.
9. IGO ASX:IGO
Profitable miner albeit much less so this year than last year. Exposed to Lithium and Nickel which have both had a very poor 2024.
10. Syrah Resources ASX:SYR
Natural graphite producer that has struggled due to competition from Chinese produced synthetic graphite. Currently losing money but forecast to be profitable in 2026. Graphite price will have the most significant say in that.
11. Talga Group ASX:TLG
Like Syrah in the graphite space but only expected to start producing in 2025. Profits not expected until 2027 but again will depend on the graphite price.
12. Omni Bridgeway ASX:OBL
Operates globally in the dispute and litigation space. Terribly inconsistent history of earnings (but more so losses). Things are expected to improve over the next two years but who really knows with this company?
13. Leo Lithium ASX:LLL
A company in the Lithium space in Africa that appears to have been the victim of some serious government corruption. Highlights the risks of investing in parts of Africa. The shares have been suspended for some time but should return albeit without an asset and just some cash having basically been ejected from their project and paid a pittance to do so.
14. Star Entertainment Group ASX:SGR
Casino and resorts operator in Australia that is has hit some regulatory hurdles. Issues around whether they will have their casino licence revoked. Changes across the board have been made by the company in attempt to prevent this. Large capital raise during the year to keep the business afloat has contributed to the share price being crushed. Shares appear to be trading below book value at current prices so wouldn’t surprise to see it on the list of best stocks this time next year but anything could happen!
15. Renascor Resources ASX:RNU
Another graphite stock that isn’t expected to start producing any revenues until 2026.
16. Ioneer ASX:INR
Lithium stock not expected to produce any revenues until 2027.
17. TerraCom ASX:TER
Coal miner in South Africa. Profitable albeit much less so with the declines in the coal price. Appears it got way too overvalued when the coal price spike in 2022 and has been falling back to earth ever since. Shares now appear to be trading around book value.
18. Helius ASX:HLS
Like many in the pathology and imaging space, Helius has struggled since peaking during Covid. The company is expected to show a loss this year before returning to profit next year.
19. Arafura Rare Earths ASX:ARU
Rare earths explorer that isn’t expected to show any revenues until beyond 2026.
20. Weebit Nano ASX:WBT
Computer memory (ReRAM) technology company that is yet to sign a significant customer for its product and is bleeding cash at an alarming rate.
Final thoughts on the 20 Biggest Losers of FY2024
In reviewing the 20 worst performing companies on the ASX this year, several common themes emerge. Many are heavily reliant on commodity prices, particularly in the lithium and graphite sectors, where price declines have severely impacted profitability. Others are speculative ventures in early development stages, with revenues and profits not expected for several years. This highlights the inherent risks of investing in industries dependent on volatile markets or still in exploratory phases. Additionally, some companies face significant operational and regulatory challenges, underscoring the importance of diversified portfolios and thorough due diligence when investing in high-risk sectors.
Post thought – the losers of FY2023
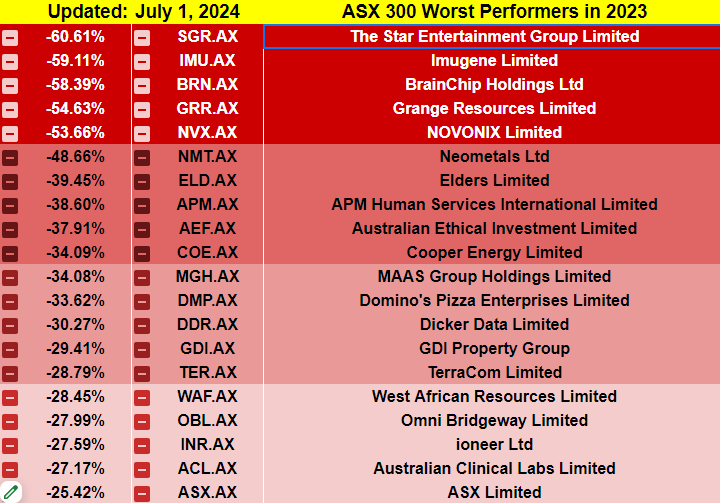
4 of the worst stocks of FY2023 are also on the list of the worst stocks of FY2024. 3 of the best stocks of FY2023 are on the list of worst stocks of FY2024.
Disclaimer: This information is provided purely for educational purposes. It takes no account of an individual’s personal financial circumstances and hence can in no way constitute financial advice. The above data may be subject to errors or inconsistencies for which the author takes no liability. It is imperative that all investors do their own research or if they need advice, seek it from a qualified financial adviser.
20 Biggest Losers of FY2024
GROWTH Model Update 6
This is a restricted members post.
Austin Engineering (ASX:ANG) Analysis
About
Austin Engineering Limited (ANG.AX) is an Australian-based global engineering company specializing in the design, manufacture, and supply of custom mining equipment and related services. Established in 1982, Austin Engineering focuses on creating innovative solutions for the mining industry, particularly in the areas of loading and hauling. Its product range includes off-highway dump truck bodies, excavator buckets, water tanks, and tyre handlers, all tailored to enhance productivity and safety in mining operations. The company operates through segments in the Asia-Pacific, North America, and South America, providing both proprietary products and repair and maintenance services. Austin Engineering has built a reputation for leveraging its engineering intellectual property and expertise to deliver customized solutions that meet the specific needs of mining companies, contractors, and original equipment manufacturers around the world.
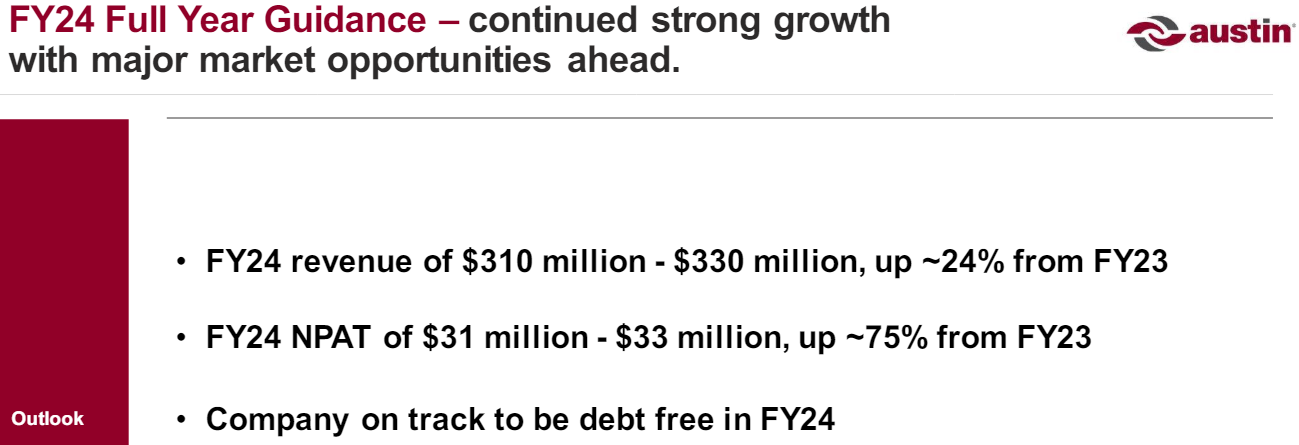
Update September 15, 2024
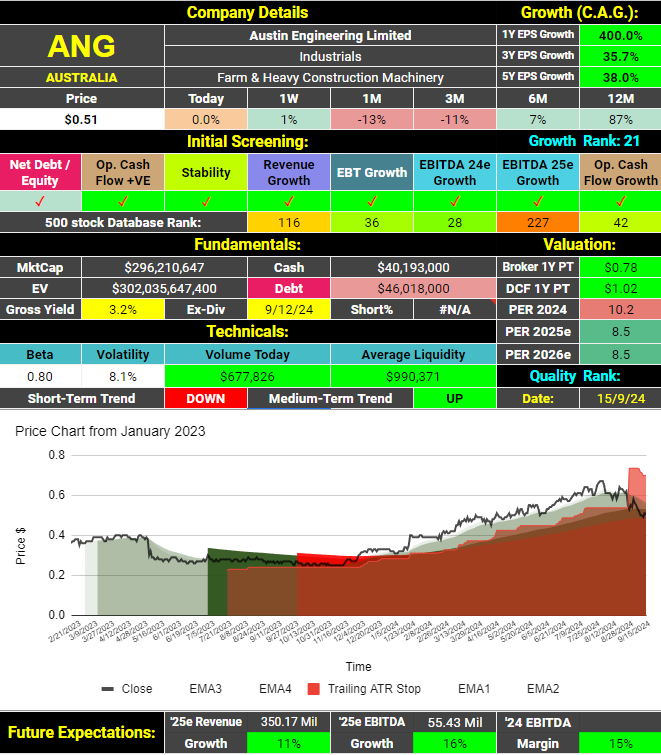
The full-year result announced in August has not been received well by the market. The share price has now moved in to a short-term down-trend. It does appear to have found some support at the medium-term duration moving averages. Growth from here is predicted to be slower than it was last year.
On a PER basis, the company appears cheap and the growth model agrees. The 2 analysts that cover Austin Engineering feel the shares are cheap with a consensus price target over 50% above the current price. Growth may be slowing but you would have to think the value investors out there would be getting interested in this company.
*** end update
Initial Screening
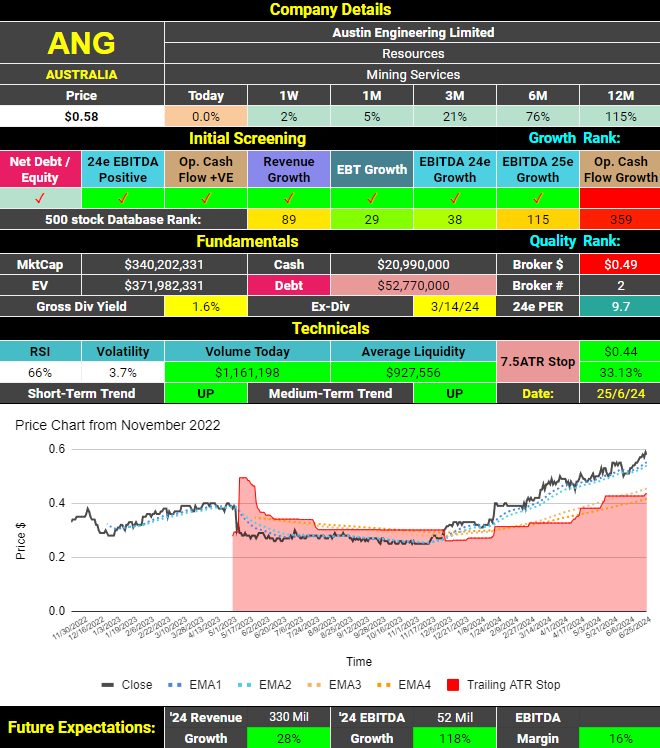
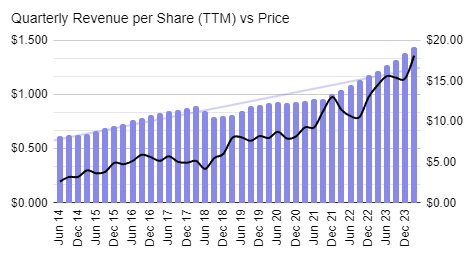
Austin Engineering (ASX:ANG) receives 7 out of 8 possible ticks in the initial screening. Debt is low and revenue and earnings are growing and expected to continue growing. The only blot on the report is that Operating cash flows have been falling. The company pays a small, fully-franked dividend. The share price has been in an impressive uptrend of over 12 months now seeing the shares 115% above what they were this time last year.
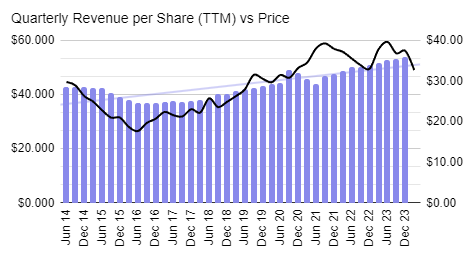
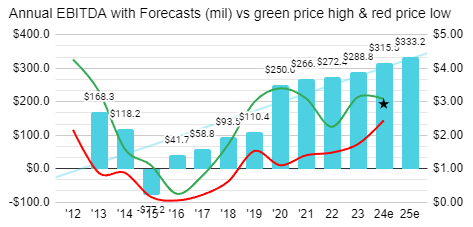
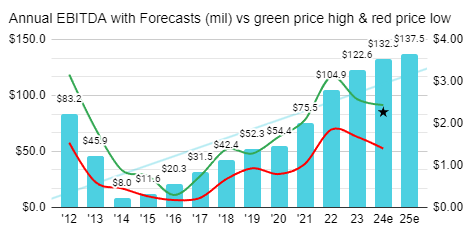
Fundamental analysis
This company seems to be very different post ~2016 so we will look at it’s number from then:
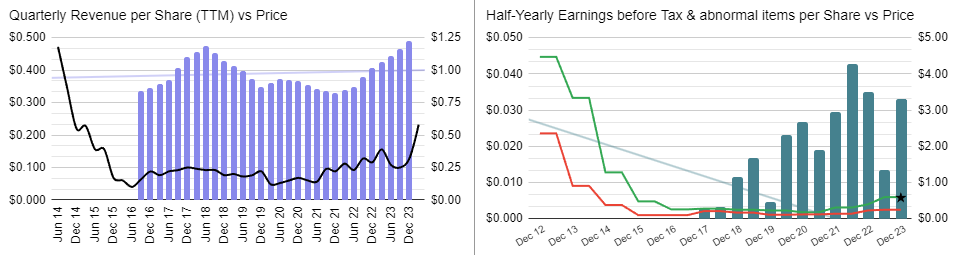
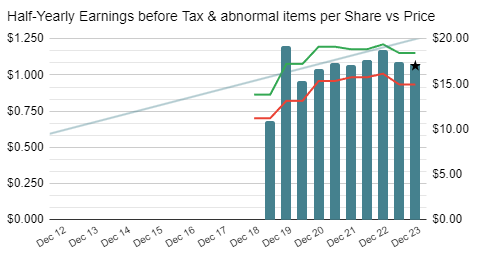
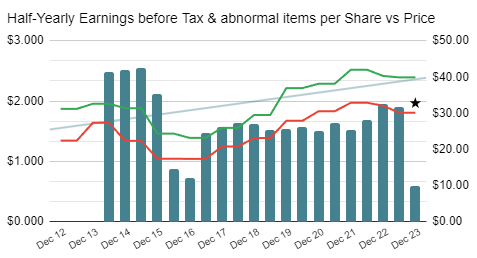
Like many mining services companies, historical performance appears cyclical. Presently the cycle seems to be in their favour.
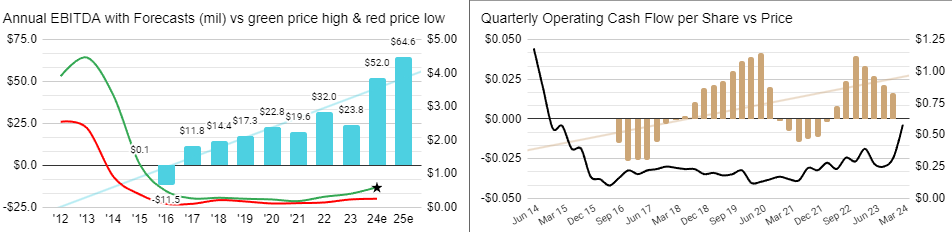
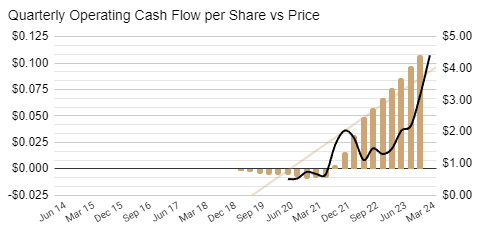
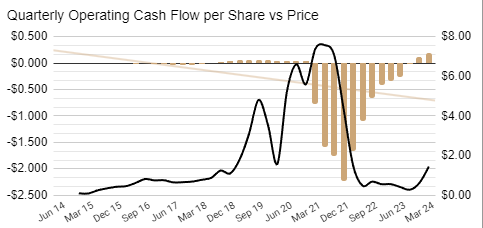
Operating cash flows are most choppy of all for this company for some reason while EBTIDA has been more consistent. It could be that Operating cash flows fluctuate more due to changes in inventories since the company does manufacture and supply capital goods.
Austin Engineering (ASX:ANG) Analysis is #533 on the ASX list of most shorted stocks. This is less than 0.1% of the stock on issue. Short selling is not a factor for this company.
Quality Analysis
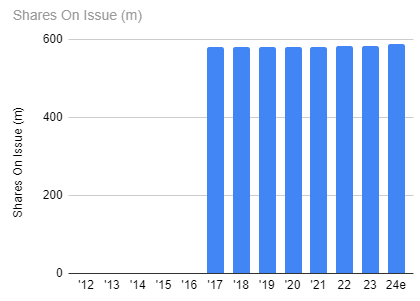
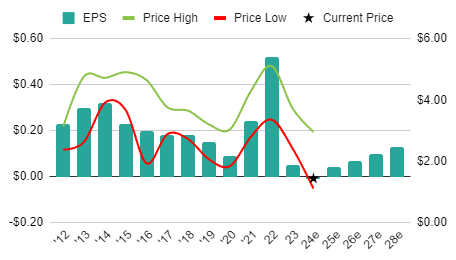
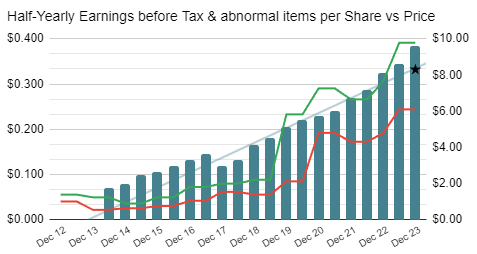
This company does not have a history of diluting its shareholders.
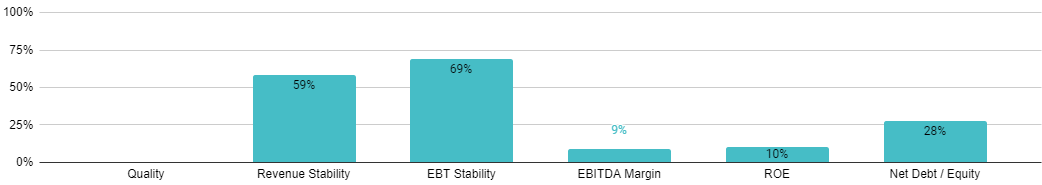
Revenues only increase slightly better than 1 in 2 times when this company reports. Earnings are more stable although nowhere near the levels of the best companies in this regard. Margins and ROE are both on the low side. Debt is low but regardless, this can only be considered a low quality company at this point in time.
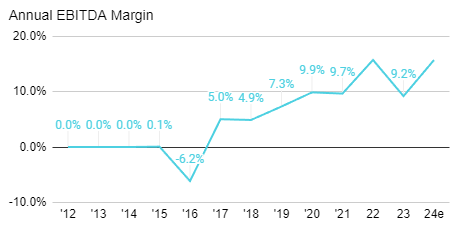
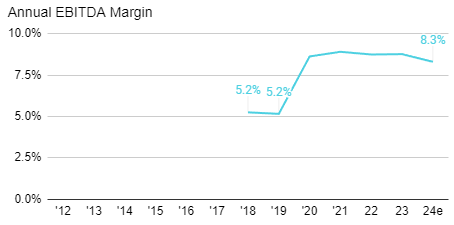
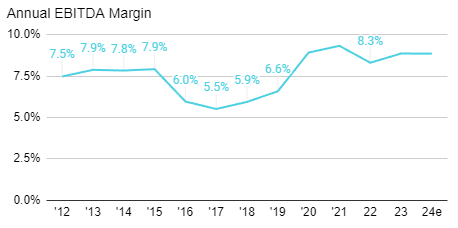
Margins have been gradually trending higher which is clearly a positive. As we have seen above, earnings have been too. The company talks of being debt free this year. A lot of factors are moving in the right direction which will only see the quality of this company improve if they continue.
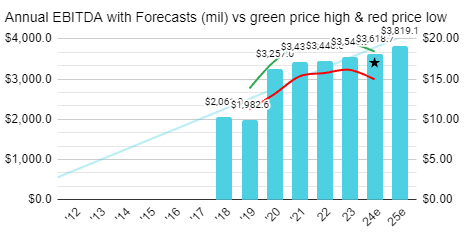
Valuation
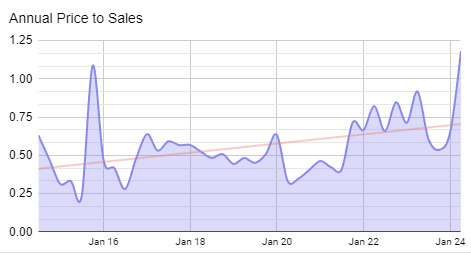
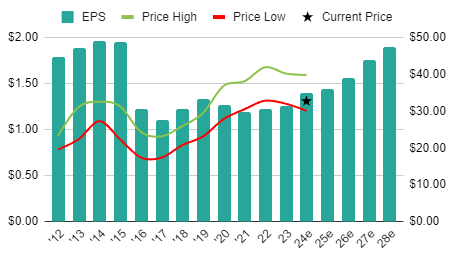
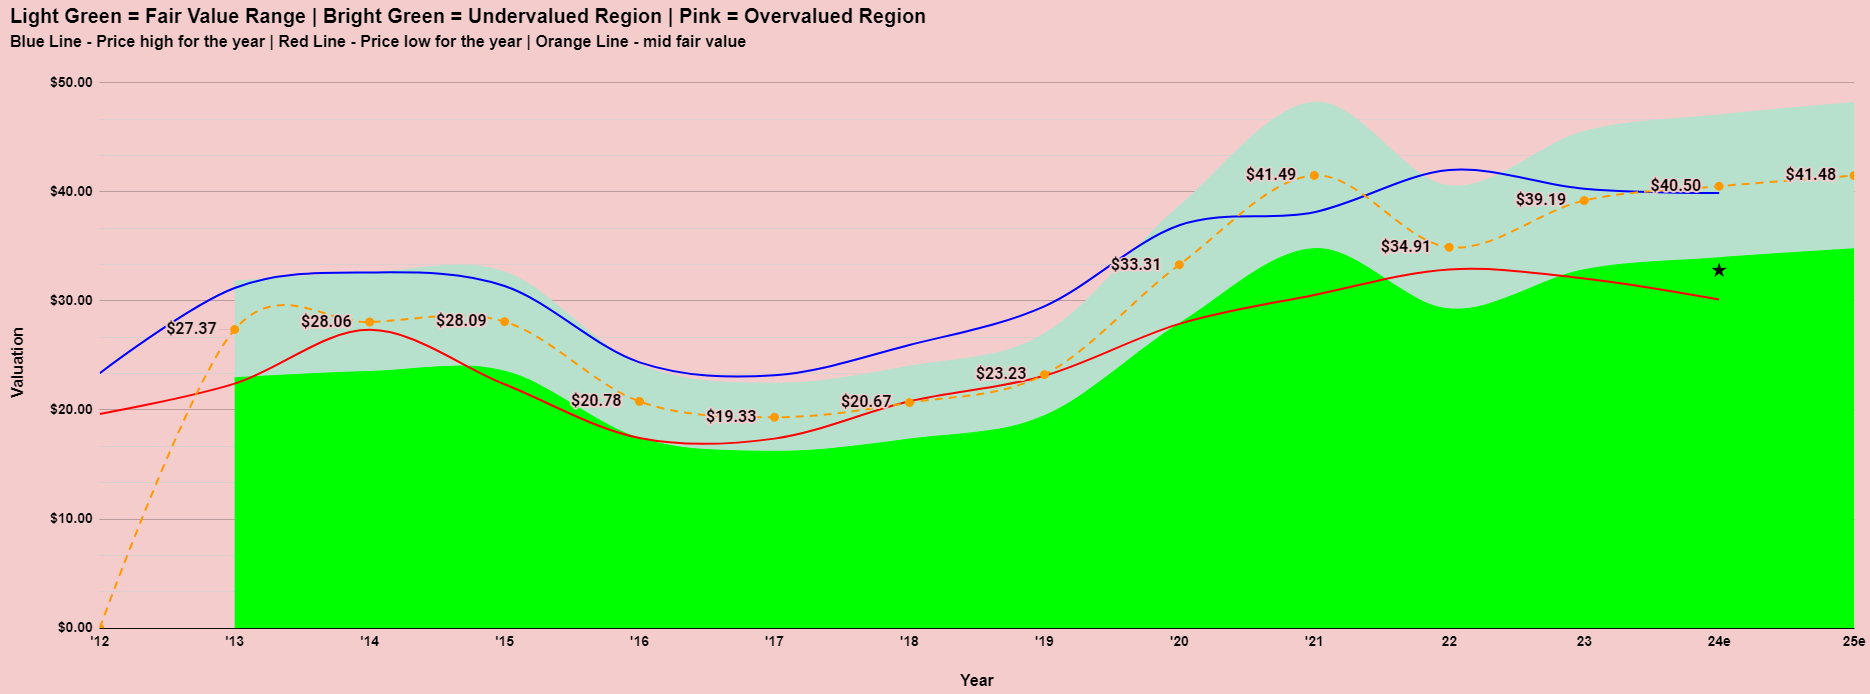
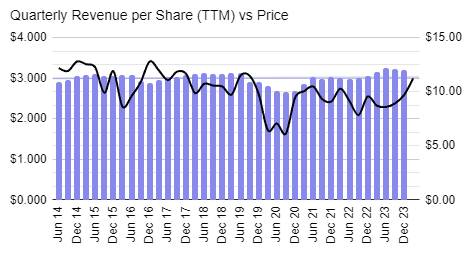
The market is viewing Austin Engineering (ASX:ANG) quite favourably at present with the shares being rewarded with its highest price to sales ratio ever over the period of time which I am looking. Despite this, the Price Earnings Ratio based on expected earnings this year (2024) is only 9.7. It is possible this will continue to rise as the company continues deliver improved results.
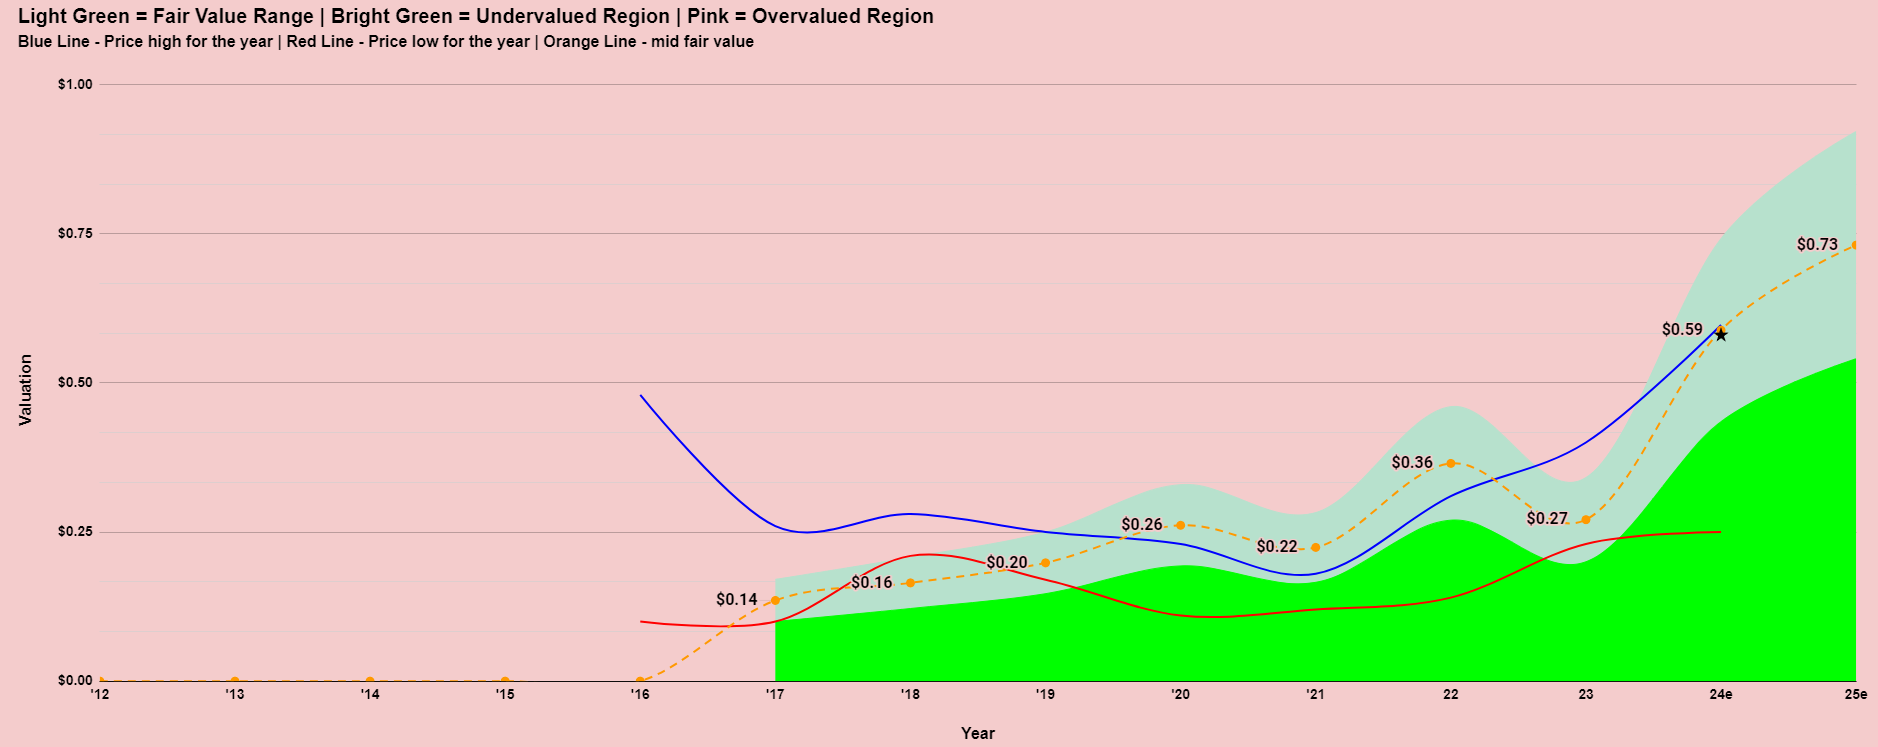
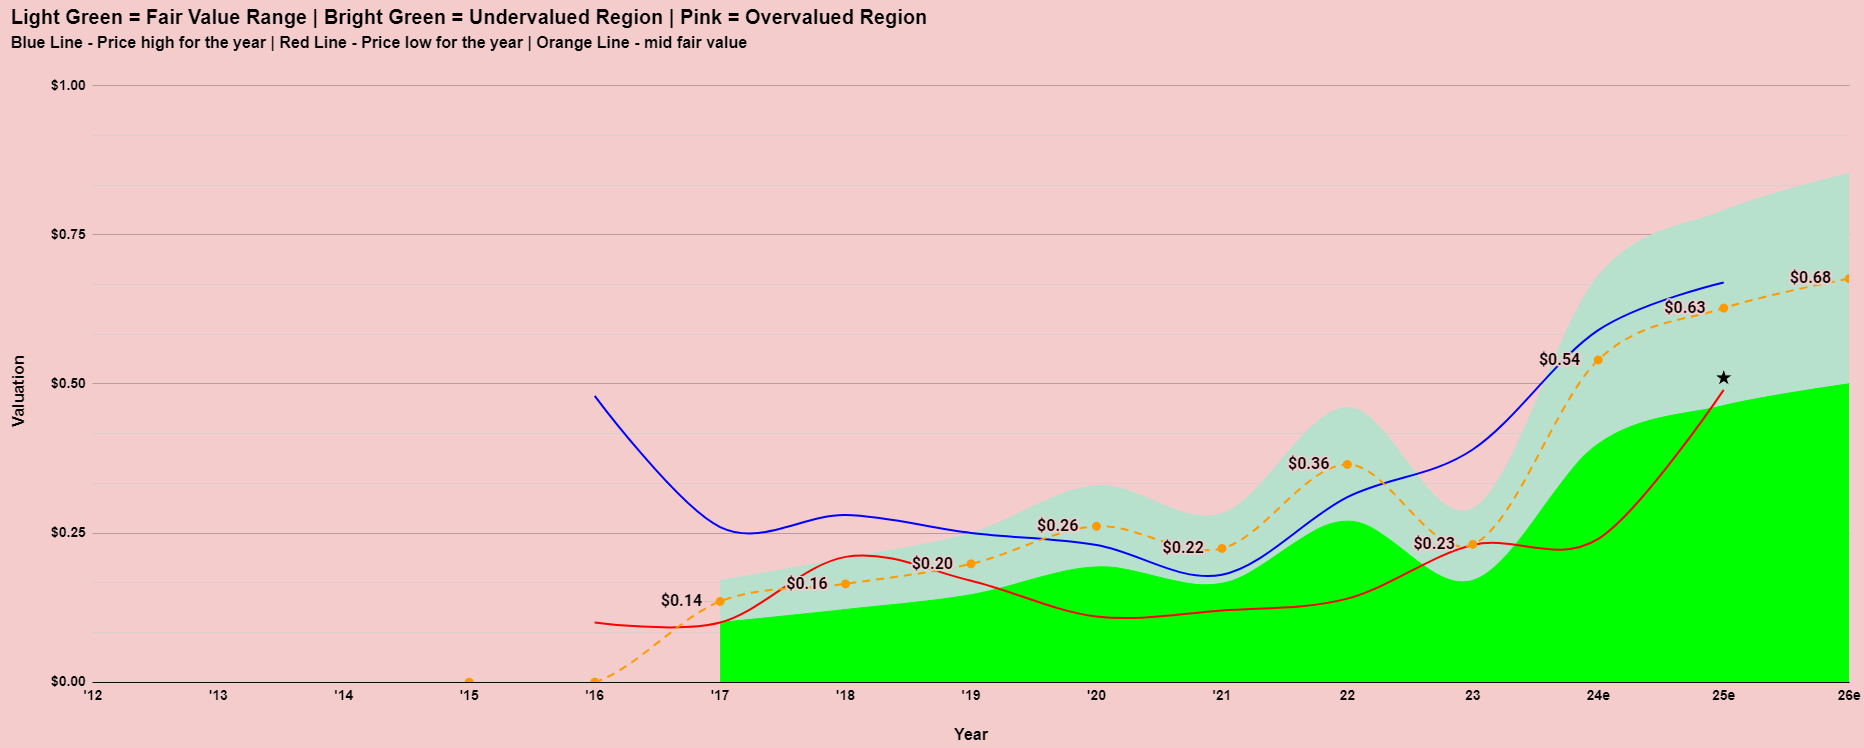
Having such a choppy past makes it hard to get a grip on the appropriate valuation of this company. The valuation model is suggesting its now trading somewhere around fair value. As we can see though, it has rarely traded around that level of extended periods of time.
News From The Company
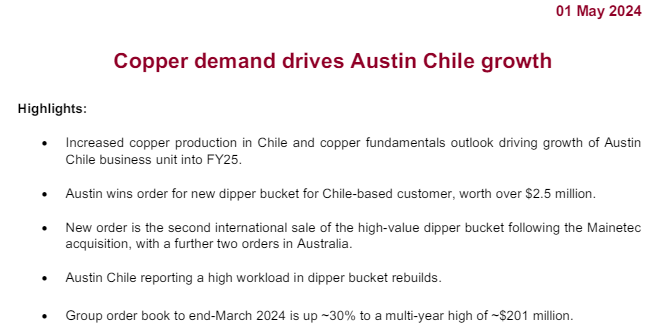
It would appear that the surge in copper price from February to May this year has been beneficial for this company. It must be noted that the copper price has fallen back quite a lot through June from a peak of over $5.10 a pound in May to a current price of $4.44 (25/6/24).
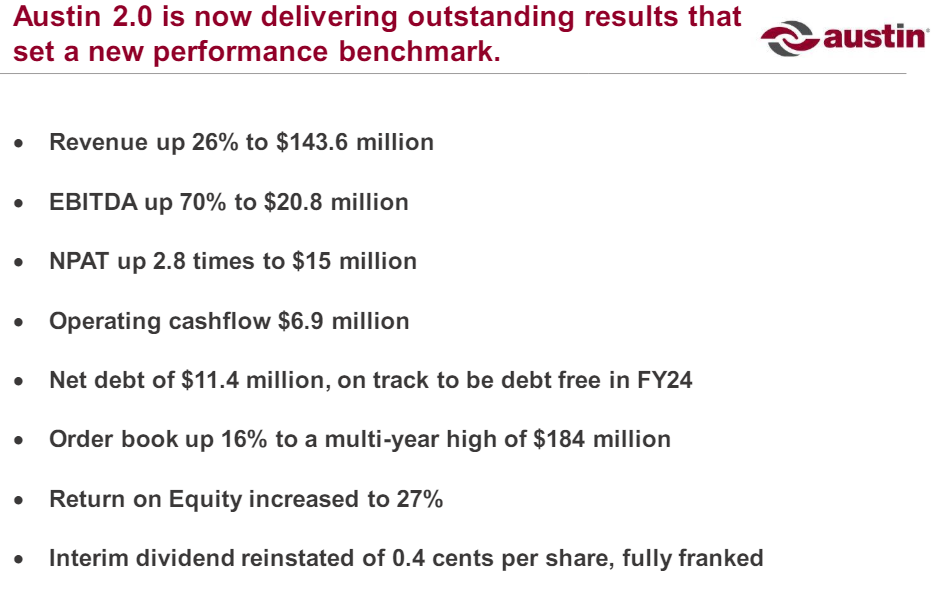
Source: Rottnest Conference Presentation March 2024
The company is very positive in their outlook .
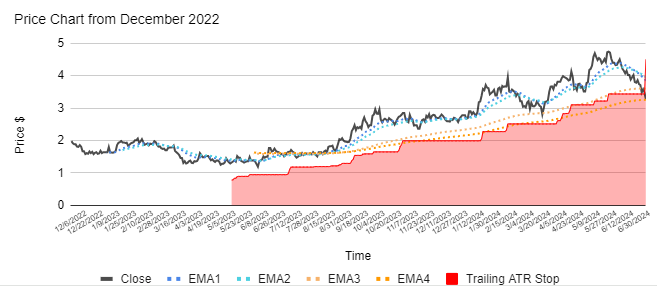
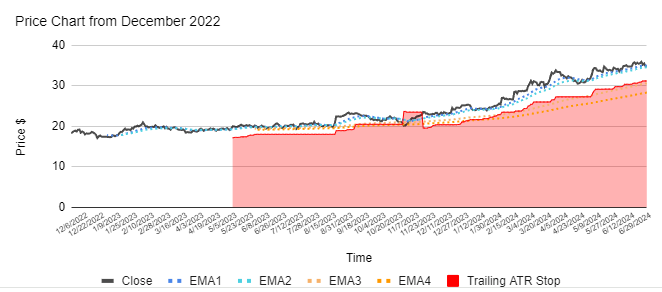
Technical Analysis
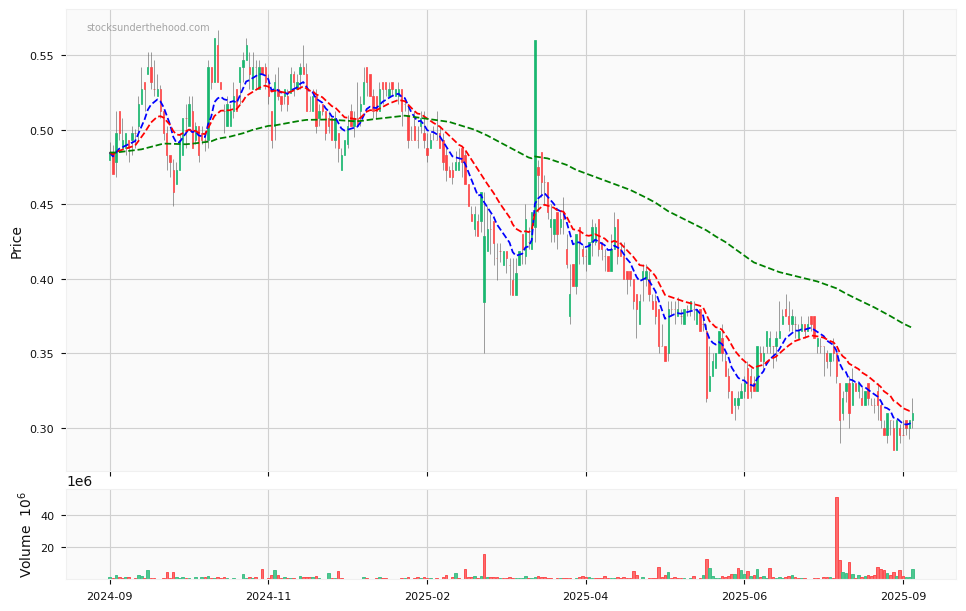
Note: This is a live chart. The technical analysis in this report should be considered up to the date of this report.
The share price of this company is in a short and medium term uptrend.
Final thoughts on Austin Engineering (ASX:ANG)
Austin Engineering (ASX:ANG) is a turnaround story. Like many turnaround stories, it can look a bit ugly at first glance. If we allow ourselves to zoom in on what the company has been doing in more recent times then the picture improves a lot. This is a cyclical stock though, but nevertheless, the cycle seems to be favourable for them at the moment. The share price has been rising along with the valuation the market is prepared to give it. By many measures that valuation still appears low with a PER of just 9.7 based on expected earnings this year. The outlook from the company is positive with a strong forward order book. Momentum is to the upside and nothing from the latest communications from the company suggests that is about to change.
Disclaimer: This information is provided purely for educational purposes. It takes no account of an individual’s personal financial circumstances and hence can in no way constitute financial advice. The above data may be subject to errors or inconsistencies for which the author takes no liability. It is imperative that all investors do their own research or if they need advice, seek it from a qualified financial adviser.
Austin Engineering (ASX:ANG) Analysis
Integrated Research (ASX:IRI) Analysis
This is a restricted members post.
Intelligent Monitoring Group (ASX:IMB) Analysis
This is a restricted members post.
Coles vs Woolworths June 2024
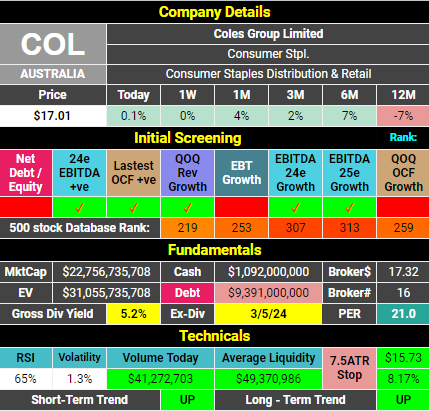
Coles Group ASX:COL |
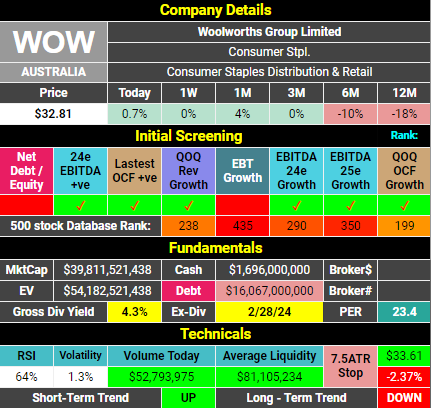
Woolworths Group ASX:WOW |
|---|---|
 |
 |
 |
 |
 |
 |
Margins for both companies are very similar. |
 |
 |
Woolworths has found recent times to be much more difficult. |
EPS has grown from 74cps to 78cps since 2019 to 2023. 5.4% |
EPS has fallen from 133cps to 126cps since 2019 to 2023. -5.3% |
Both companies appear to be offering some value at today’s prices. |
Woolworths has had the harder year but analysts believe it’s just a blip and hence their forward numbers suggest some upside from these levels. |

Observations
Since October 2019, Woolworths Group ASX:WOW shares have outperformed Coles Group ASX:COL shares by amazingly less than 1%. However, during that time it is Coles that has grown profits more. Coles also pays the higher dividend of the two. Coles also has the lower Price to earnings ratio. Based on all of that you would think Coles is the better buy. However, the market has always given a slight premium to Woolworths for some reason and so today it is Woolworths that is looking most undervalued compared to historical valuations. All in all, it is remarkable how similar both of these companies are. I guess when you’re part of a duopoly it’s best to maintain the status quo though, right?
Disclaimer: This information is provided purely for educational purposes. It takes no account of an individual’s personal financial circumstances and hence can in no way constitute financial advice. The above data may be subject to errors or inconsistencies for which the author takes no liability. It is imperative that all investors do their own research or if they need advice, seek it from a qualified financial adviser.
Coles vs Woolworths June 2024
A Chart For Each ASX300 Best Performer
Let’s have a look at the best performing stocks from the ASX 300 over the past month and see if there is anything we can learn from them to make us better investors.
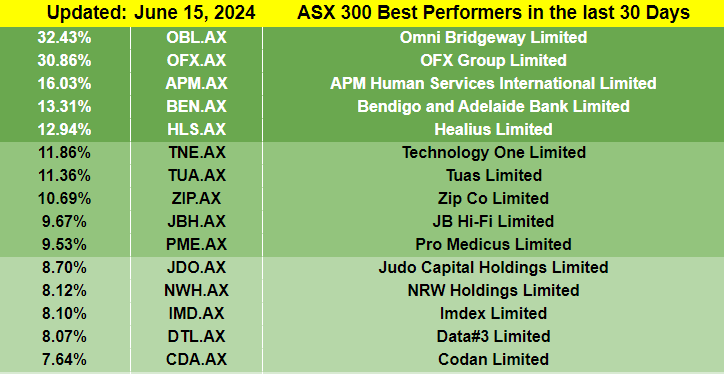
June is the most volatile month for the ASX, at least in recent years. Tax-loss selling is a big factor. Another factor, amongst the smaller cap stocks is lessening liquidity which only serves to exacerbate these tax-loss movements.
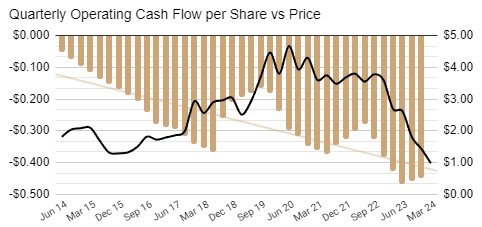
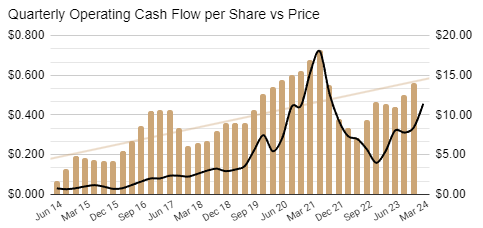
1. Omni Bridgeway – ASX:OBL
On this chart we can see the share price in black and the operating cash flows history in gold. Neither paint an inspiring picture. Despite this the stock is up 32% in the past 30 days. The only announcement in that time has been that a fund manager has been accumulating shares. This looks like a simple bounce from very oversold levels. The medium term trend remains down.
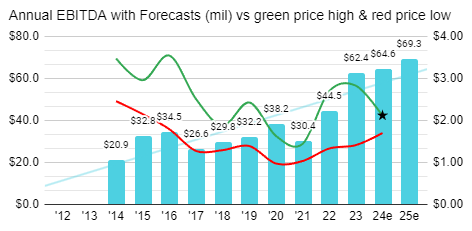
2. OFX Group Limited – ASX:OFX
Latest results from the company were sound and as a result brokers have increased their forward numbers. They were predicting falling profits for the next 2 years but have now upgraded to show growth. The company is bouncing from oversold levels. The medium term trend has now shifted to be rising once again.
3. APM Human Services International Limited – ASX:APM
The share price has bounced due to a takeover offer. Despite consistent growing in revenues and cash-flows, the market has never really liked this company.
4. Bendigo and Adelaide Bank Limited – ASX:BEN
https://www.bendigobank.com.au/
The story of this company is one of no growth. A recent update doesn’t change that narrative but it would appear that things aren’t as bad as the market was expecting. The company is bouncing from oversold levels.
5. Healius Limited – ASX:HLS
The share price has been sliding after peaking during Covid. Analysts are not forecasting earnings to start improving until next year. This looks like a simple bounce from oversold levels. The medium term trend remains down.
6. Technology One Limited – ASX:TNE
https://www.technologyonecorp.com/
An amazing track record of increasing revenues and earnings sees this company considered by many to be among the highest quality on the ASX. The share price continues to rise as the company continues to deliver improving results.
7. Tuas Limited – ASX:TUA
Much earlier days in the life of this company but similar sentiments to those expressed for ASX:TNE. The share price continues to rise as the company continues to deliver improving results.
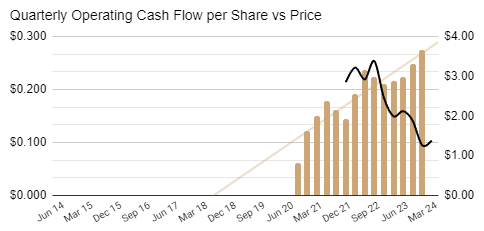
8. Zip Co Limited – ASX:ZIP
This company has recently crossed a significant milestone becoming operating cash flows positive. While many have been sceptical about the validity of this business, more are starting to believe as they continue to improve its financial position. The share price continues to rise as the company continues to deliver improving results.
9. JB Hi-Fi Limited – ASX:JBH
The theory is the market is looking through the current sales weakness and embracing the prospect of rate cuts in the near future. Analysts, at best, are predicting flat returns over the next five years. Grossed-up yield is almost 6% which improves the appeal of this company if interest rates do fall. The share price is rising as Bond Yields fall in the US and the market anticipates rate cuts in most developed economies.
10. Pro Medicus Limited – ASX:PME
An amazing track record of increasing revenues and earnings sees this company considered by many to be among the highest quality on the ASX. The share price continues to rise as the company continues to deliver improving results.
11. Judo Capital Holdings Limited – ASX:JDO
This company is gradually getting more coverage and attention as they continue to do everything right. The share price continues to rise as the company continues to deliver improving results.
12. NRW Holdings Limited
The stock has risen on the back of a positive announcement regarding some new contract wins, which is part of a broader uptrend for the share price of this company on the back of a number of years of consistent performance.
13. Imdex – ASX:IMD
The stock has been on the move since a presentation back in early May. Like the company above, they have put together a string of consistent results for a number of years now and are forecast to continue doing so.
14. Data#3 Limited
The share price continues to rise as the company continues to deliver improving results. There has not been any announcements from them in the past month.
15. Codan Limited
The share price continues to rise as the company continues to deliver improving results. Two separate announcements have been released by the company in the past month revealing that directors have been adding to their positions.
Conclusion
The top performers on the ASX300 over the past 30 days fall into three categories:
- Companies performing well, recognized by the market, with rising share prices.
- Companies previously underperforming, now seen as undervalued, experiencing a rebound.
- Companies benefiting from announcements that trigger strong buying.
I focus on identifying companies in the first category. While announcements can boost short-term performance, only significant achievements like profit upgrades or major contract wins drive long-term growth. I avoid companies with a history of poor performance.
Disclaimer: This information is provided purely for educational purposes. It takes no account of an individual’s personal financial circumstances and hence can in no way constitute financial advice. The above data may be subject to errors or inconsistencies for which the author takes no liability. It is imperative that all investors do their own research or if they need advice, seek it from a qualified financial adviser.
A Chart For Each ASX300 Best Performer
QUALITY Model Update 2
This is a restricted members post.
JoinBig River Industries – Why?
Today I conducted an analysis of this small ASX company which can be viewed by subscribers by following the link:
Big River Industries ASX:BRI June 13, 2024
The reason why is because I was reading the most recent “Shareholder Update” from NAOS Asset management. NAOS manage three LICS on the ASX.
When I’ve looked at these LICs in the past, this company has been a core holding in at least two, if not all of them. I’ve always wondered why because at face value this never appeared to me to be a company to be excited about. View the analysis above to draw your own conclusions.
This is what the NAOS had to say about ASX:BRI:
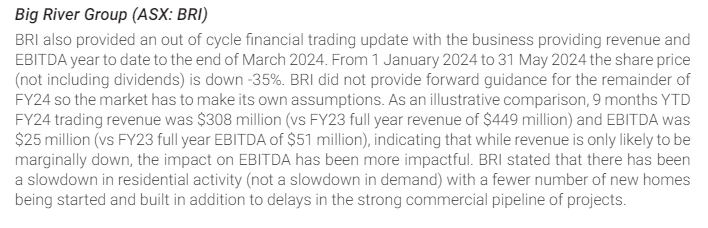
The shareholder update was looking at the performance of 3 core holdings in their portfolios, one of which was ASX:BRI.
Needless to say, I won’t be in any hurry to analyse the other two companies.
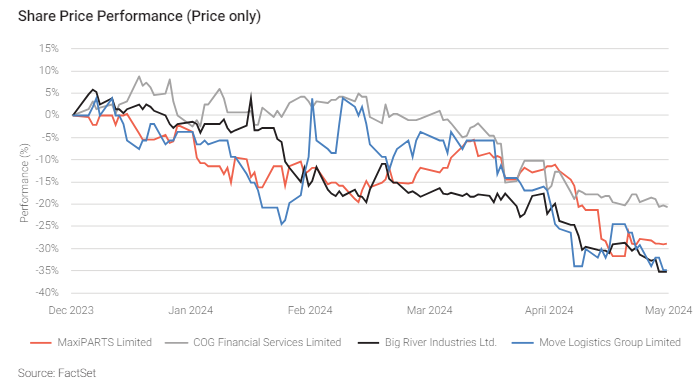
NAOS shares these observations collected from various companies the follow:
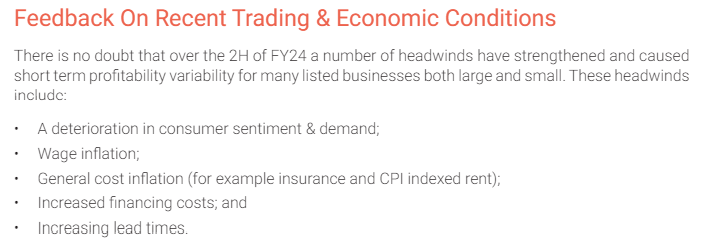
I guess all of that is consistent with this:
This is all good and important information.
All in all though, NAOS has always puzzled me. Their three LICs all struggle and never trade near their NTA values. Their investment approach seems to be top-down which means they form a thesis about a marco theme and then buy stocks they believe will benefit from that theme. They play the long game which can always gain you a lot of leeway. If you invest for the long-term and your investments fall you can easily just say they need more time.
In the case of ASX:BRI, I get it. Australia needs more housing as well as other infrastructure. This company should benefit. My question is a simple one – is this the best company to play the theme? There are dozens of stocks our the ASX that will benefit from a housing and infrastructure boom. Many are already doing so. Investors in ASX:BRI will have to wait a bit longer to see if they can join the party.
Disclaimer: This information is provided purely for educational purposes. It takes no account of an individual’s personal financial circumstances and hence can in no way constitute financial advice. The above data may be subject to errors or inconsistencies for which the author takes no liability. It is imperative that all investors do their own research or if they need advice, seek it from a qualified financial adviser.
Big River Industries – Why?
Big River Industries (ASX:BRI) Analysis
This is a restricted members post.
PeopleIn (ASX:PPE) Analysis
This is a restricted members post.
Catapult Group (ASX:CAT) Analysis
This is a restricted members post.
Volatility Index (VIX)
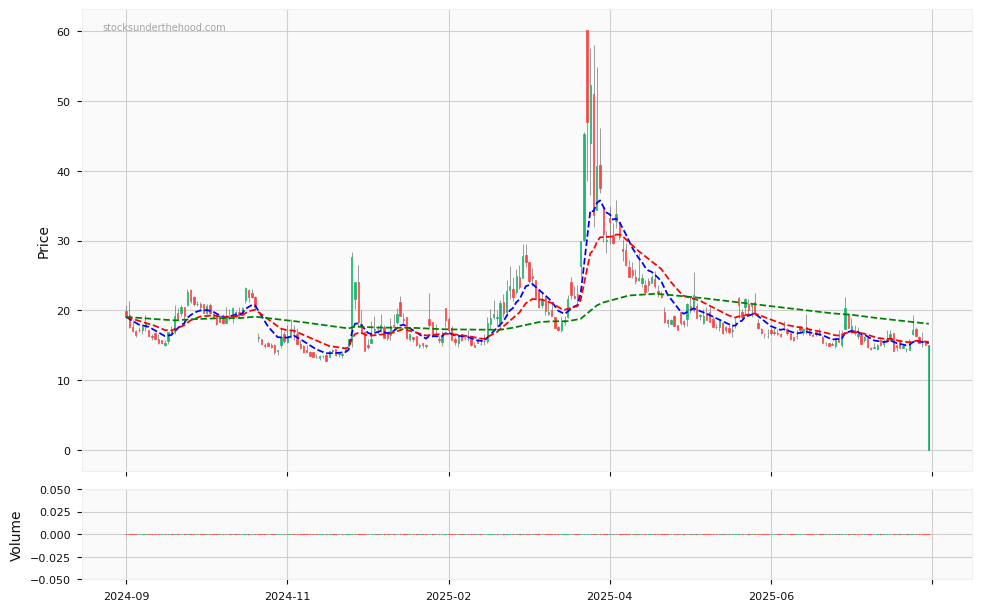
The VIX, or Volatility Index, is a widely used measure of market expectations for volatility in the U.S. stock market over the next 30 days, derived from options prices on the S&P 500 Index. Often called the “fear gauge,” the VIX rises during periods of market uncertainty, stress, or sharp price swings, reflecting investor anxiety and demand for portfolio protection. Conversely, a low VIX indicates relative market calm and stability. While not directly a tradable asset, the VIX influences the pricing of derivatives and is used by investors as a tool to hedge risk or speculate on market volatility. It serves as a barometer of sentiment, often inversely correlated with stock market performance.
Volatility Index (VIX)
USD Bitcoin
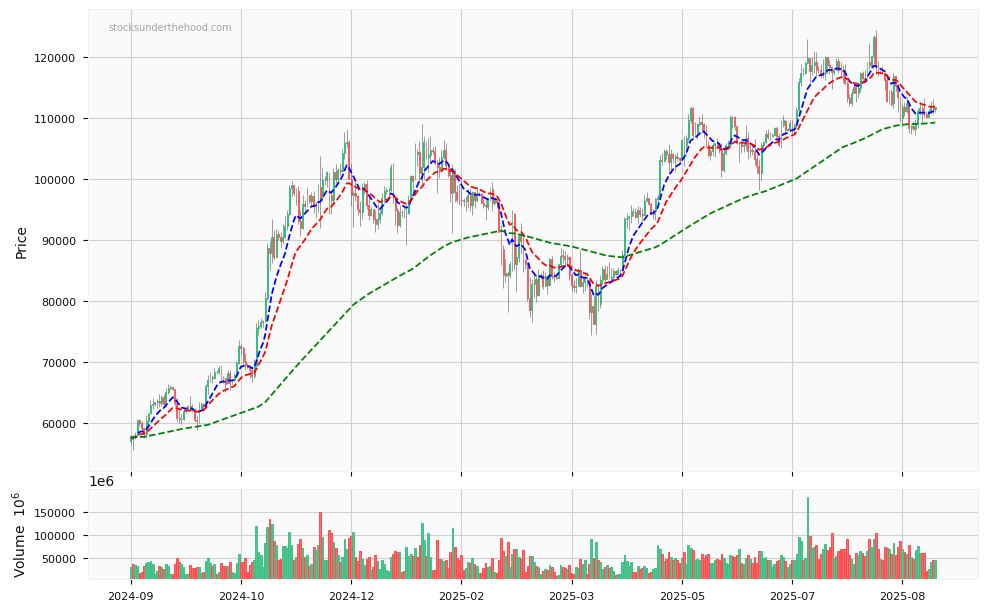
Bitcoin is a decentralized digital currency that operates on a peer-to-peer network without a central authority, using blockchain technology to ensure secure and transparent transactions. Often referred to as the first cryptocurrency, it was created in 2009 by an anonymous entity known as Satoshi Nakamoto. Bitcoin’s price is influenced by factors like supply and demand dynamics, market speculation, macroeconomic conditions, adoption rates, and its perception as a store of value or “digital gold.” Its price can represent market sentiment toward cryptocurrencies as a whole, broader risk appetite, or skepticism of traditional financial systems. As a highly volatile asset, Bitcoin is both an investment vehicle and a barometer for the evolving landscape of digital currencies.
USD Bitcoin
ASX SPI 200 Index Futures
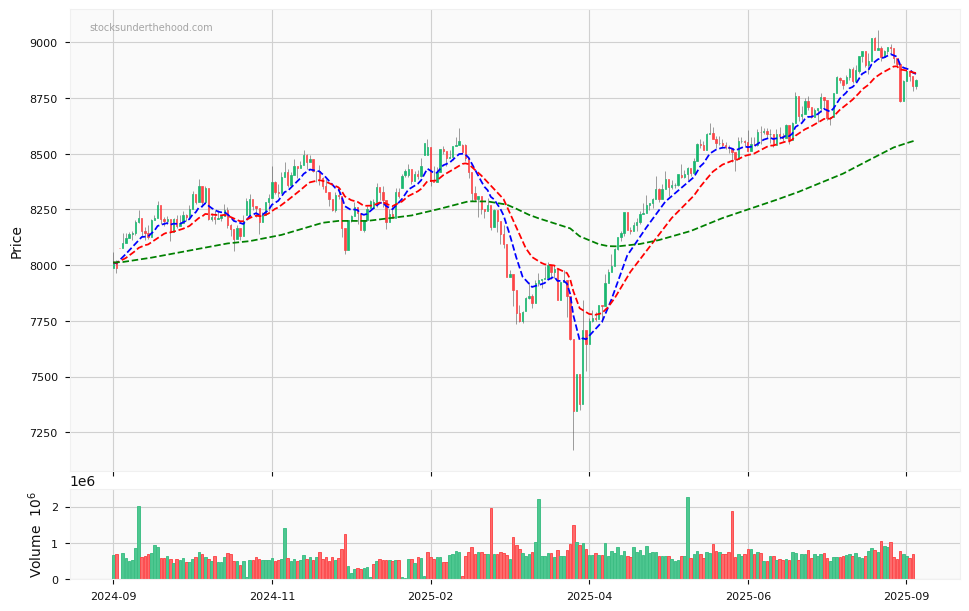
The ASX SPI 200 Index Futures is a derivative contract that allows investors to speculate on or hedge against the future movements of the S&P/ASX 200 Index, which tracks the performance of 200 of the largest companies listed on the Australian Securities Exchange. Traded on the ASX 24 (formerly the Sydney Futures Exchange), these futures contracts provide exposure to the Australian equity market without directly buying shares. The SPI 200 is often used by institutional investors and traders to manage risk, gain leverage, or express views on the direction of the Australian stock market. Its price reflects market expectations for the index’s future value, influenced by economic data, corporate earnings, global market trends, and investor sentiment.
ASX SPI 200 Index Futures