Date: Sunday, November 30, 2025, 7:30:41 PM | This table shows the performance of ASX’s most shorted stocks over multiple time frames.
| Short % | Update | Code | Previous Close | Today | Last 30 days | Last 90 days | Last 180 days | Last 360 days | Last 2 years |
|---|---|---|---|---|---|---|---|---|---|
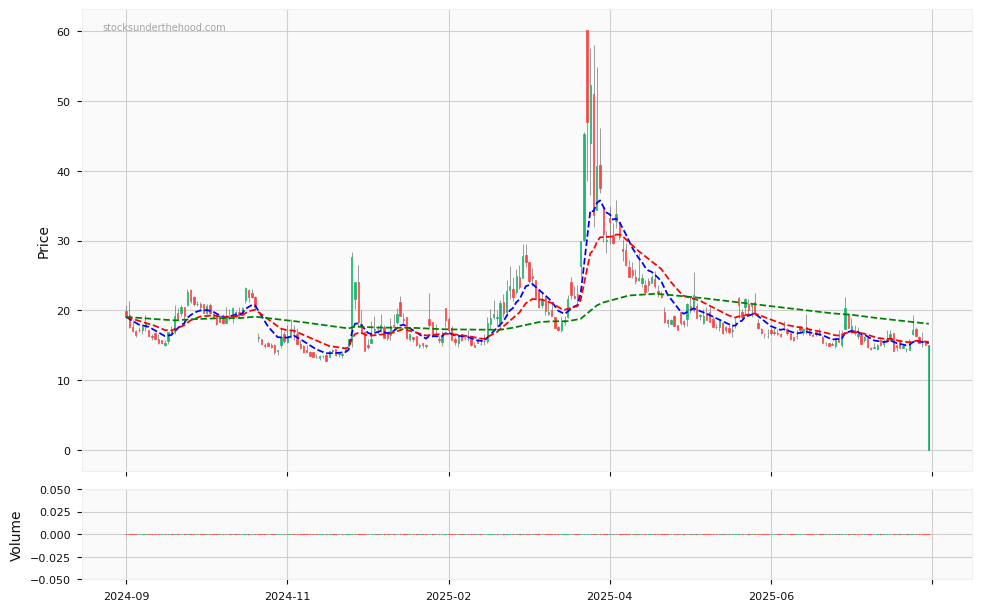
| 21.7 | 6/18/2025 | ASX:BOE | $1.565 | 3.5% | -15.2% | -19.0% | -58% | -39% | -59% |
| 14.4 | 5/5/2024 | ASX:DMP | $21.170 | 1.0% | 19.2% | 46.1% | -4% | -35% | -60% |
| 12.8 | 10/4/2025 | ASX:PDN | $7.850 | 3.4% | -14.3% | 0.5% | 36% | 5% | -15% |
| 12.3 | 10/4/2025 | ASX:GYG | $23.390 | 1.0% | -11.7% | -7.4% | -22% | -47% | |
| 11.6 | 10/6/2025 | ASX:IEL | $5.280 | -0.4% | -6.9% | -11.0% | -30% | -59% | -77% |
| 10.9 | 2/18/2025 | ASX:PLS | $3.950 | 2.5% | 22.7% | 66.7% | 255% | 69% | 13% |
| 10.6 | 7/27/2025 | ASX:PWH | $8.150 | 1.0% | -3.5% | 5.5% | 23% | 1% | -15% |
| 10.4 | 11/11/2025 | ASX:TLX | $15.300 | -0.5% | -5.9% | 2.1% | -42% | -39% | 59% |
| 9.9 | 11/19/2024 | ASX:FLT | $12.700 | 6.5% | 9.9% | 5.9% | 3% | -20% | -28% |
| 9.8 | 10/25/2025 | ASX:PNV | $1.200 | 2.5% | -10.9% | -2% | -45% | -17% | |
| 9.3 | 7/23/2025 | ASX:CUV | $11.510 | 3.4% | 6.2% | 11.0% | 16% | -8% | -31% |
| 9.1 | 10/11/2025 | ASX:IPH | $3.480 | 1.1% | -3.3% | -21.1% | -28% | -29% | -46% |
| 9.1 | 1/1/2025 | ASX:ILU | $6.540 | -1.4% | -3.0% | 2.1% | 79% | 14% | -5% |
| 9.1 | 12/10/2024 | ASX:CTD | $16.070 | 0.0% | 18% | 15% | -13% | ||
| 8.9 | 9/20/2025 | ASX:NAN | $4.220 | 1.4% | -6.1% | 0.5% | -4% | 32% | -3% |
| 8.5 | 10/4/2025 | ASX:DGT | $2.670 | 4.9% | 6.9% | -11.1% | -19% | ||
| 8.0 | 4/13/2024 | ASX:VUL | $6.010 | 0.0% | -4.0% | 49.1% | 59% | -5% | 172% |
| 7.2 | 9/17/2025 | ASX:BRG | $30.980 | -0.1% | 1.7% | -5.9% | 7% | -11% | 24% |
| 6.8 | 10/11/2025 | ASX:MSB | $2.690 | 0.7% | 8.0% | 34.2% | 69% | 54% | 904% |
| 6.7 | 6/23/2025 | ASX:TWE | $5.740 | 1.4% | -4.0% | -26.2% | -28% | -49% | -44% |
| 6.6 | 6/13/2025 | ASX:KAR | $1.540 | 0.0% | -2.5% | -11.0% | -6% | 13% | -20% |
| 6.6 | 5/24/2025 | ASX:DYL | $1.585 | 3.5% | -8.4% | -12.3% | 26% | 33% | 64% |
| 6.5 | 8/29/2025 | ASX:LIC | $5.720 | -0.3% | 9.6% | 4.0% | -19% | -38% | -68% |
| 6.3 | 10/6/2025 | ASX:IPX | $5.090 | 0.4% | -24.7% | -27.0% | 48% | 12% | 299% |
| 6.1 | 10/31/2025 | ASX:DRO | $2.000 | -1.0% | -51.4% | -38.9% | 55% | 183% | 539% |
| Average | 1.38% | -3.8% | 1.6% | 17% | 0% | 68% | |||
| Median | 0.98% | -3.7% | 0.5% | 3% | -7% | -15% | |||
| Sum | VAS | ASX 200 ETF | -0.07% | -2.7% | -3.4% | 3% | 2% | 20% | |
| 239.0 | MVS | Small Cap ETF | 1.43% | 1.4% | 4.2% | 16% | 16% | 27% |