Author: Nathan

US Sector Performance

Date: 01-12-2025 08:32:02 | This table shows the latest performance of the different sectors in the US.

Sector Market cap Div yield % Change % Volume Industries Stocks
Technology Services 19.91 TUSD 0.47% 0.77% 14.13 M 4 636
Electronic Technology 17.92 TUSD 0.53% 0.48% 37.93 M 9 348
Finance 15.55 TUSD 1.85% 0.61% 2.63 M 14 1,305
Health Technology 7.37 TUSD 1.44% -0.34% 3.07 M 5 929
Retail Trade 6.35 TUSD 0.64% 1.07% 10.56 M 10 179
Consumer Non-Durables 2.86 TUSD 3.25% 0.39% 3.48 M 9 160
Producer Manufacturing 2.78 TUSD 1.00% 0.47% 1.43 M 9 289
Energy Minerals 2.51 TUSD 4.17% 0.98% 3.45 M 4 113
Consumer Durables 2.51 TUSD 0.71% 0.72% 22.1 M 8 151
Consumer Services 2.24 TUSD 1.34% 0.41% 3.14 M 10 223
Utilities 2.04 TUSD 2.85% 0.71% 1.52 M 4 111
Non-Energy Minerals 1.79 TUSD 1.68% 1.13% 3.81 M 6 182
Industrial Services 1.53 TUSD 2.97% 1.02% 1.79 M 5 145
Transportation 1.33 TUSD 1.72% 0.77% 3.07 M 6 152
Commercial Services 1.16 TUSD 0.76% 0.51% 2.16 M 5 249
Communications 1.02 TUSD 3.62% 0.69% 5.55 M 3 52
Process Industries 1.02 TUSD 2.24% 0.54% 1.38 M 8 168
Health Services 876.32 BUSD 1.56% -0.17% 1.32 M 4 84
Distribution Services 593.09 BUSD 1.23% 0.09% 778.55 K 4 97
Miscellaneous 308.46 BUSD 7.16% 0.91% 899.5 K 2 5,193
INDEXDJX:.DJI 47716.42 289.30 0.61% Dow Jones Industrial Average
INDEXSP:.INX 6849.09 36.48 0.53% S&P 500
INDEXNASDAQ:.IXIC 23365.69 151.00 0.65% Nasdaq Composite
INDEXRUSSELL:RUT 2500.43 14.32 0.57% Russell 2000 Index

Gold Seasonality

Date: 01-12-2025 08:33:02 | This table shows the monthly seasonality data for the iShares Gold Trust (IAU) ETF.

GOLD IAU Jan Feb Mar Apr May Jun Jul Aug Sep Oct Nov Dec Total
2025 6.8% 1.9% 9.4% 5.4% 2.6% -2.2% -0.6% 7.5% 9.2% 9.1% 49.2%
2024 -1.2% 0.4% 9.9% 2.0% 1.6% 0.2% 5.1% 1.7% 5.5% 4.3% -4.0% -0.6% 25.0%
2023 4.9% -5.4% 7.9% 0.4% -0.9% -2.2% 2.2% -1.2% -5.7% 8.5% 2.5% 1.0% 12.2%
2022 -1.7% 6.1% 1.4% -4.0% -1.4% -1.6% -2.0% -3.5% -2.9% -1.7% 8.5% 3.8% 1.1%
2021 -2.3% -7.3% -1.0% 3.6% 7.4% -6.9% 2.4% 0.0% -3.2% 2.1% -1.2% 3.4% -3.0%
2020 4.6% -0.1% -0.5% 6.9% 3.3% 2.1% 11.0% -0.5% -4.2% 0.4% -6.2% 7.0% 23.8%
2019 2.8% -0.5% -2.1% -0.2% 1.8% 5.9% 2.0% 9.4% -4.7% 2.6% -3.3% 3.7% 17.5%
2018 3.3% -2.0% 1.8% -2.1% -1.0% -4.7% -1.3% -2.0% -0.9% 2.4% 0.3% 5.0% -1.4%
2017 4.8% 3.2% -0.2% 0.7% 0.9% -2.1% 2.3% 4.1% -4.0% 0.0% 0.3% 2.1% 12.0%
2016 6.6% 9.9% -0.9% 4.8% -5.9% 8.9% 2.3% -3.4% 0.7% -2.9% -8.4% -1.3% 10.4%
2015 7.9% -5.6% -1.7% -0.1% 0.5% -1.4% -6.7% 3.8% -1.8% 1.6% -6.1% -0.5% -10.2%
2014 3.3% 6.5% -3.2% 0.5% -3.7% 7.0% -3.6% 0.3% -6.1% -3.0% 3.5% -2.6% -1.1%
2013 -0.5% -5.1% 1.2% -7.7% -6.2% -9.6% 5.7% 6.3% -5.7% -0.3% -8.0% -1.2% -31.2%
2012 12.7% 2.5% -6.1% -0.7% -6.3% 2.3% 1.0% 4.8% 4.9% -3.1% -0.5% -2.4% 9.2%
2011 -6.4% 6.0% 1.7% 7.4% -0.5% -2.3% 8.0% 12.7% -11.2% 5.9% 1.7% -11.7% 11.4%
2010 1.0% 1.0% -0.4% 5.8% 4.0% 1.4% -4.9% 5.6% 4.7% 3.2% 2.6% 2.5% 26.6%
2009 2.5% 2.5% -0.7% -3.4% 9.7% -4.7% 2.5% -0.1% 5.9% 5.1% 11.4% -7.3% 23.3%
2008 11.0% 4.8% -5.5% -4.6% 1.7% 3.8% -1.3% -9.0% 4.3% -16.2% 5.9% 14.3% 9.1%
2007 2.5% 2.6% -1.1% 2.1% -2.4% -0.8% 1.2% 1.1% 11.1% 6.1% -1.4% 6.4% 27.6%
2006 10.1% -1.3% 3.9% 11.9% -1.5% -4.6% 3.3% -1.5% -5.1% 1.8% 7.1% -1.8% 22.2%
2005 3.2% -1.6% 0.1% -2.9% 4.2% -0.6% 0.6% 7.7% -0.7% 5.8% 5.0% 20.8%
Average 3.6% 1.1% 0.6% 1.4% 0.0% -0.4% 1.3% 1.7% -0.1% 1.2% 0.5% 1.2% 12.1%
Positive 15 13 8 13 10 9 13 13 9 14 11 11 16
Negative 5 8 13 8 11 12 8 8 12 7 9 9 5
Since 2009
Average 2.9% 0.8% 1.0% 1.1% 0.4% -0.6% 1.5% 2.7% -1.1% 2.0% -0.4% 0.1% 10.3%
Positive 11 9 7 10 8 7 10 11 5 11 7 8 11
Negative 5 7 9 6 8 9 6 5 11 5 8 7 5

US Dollar Gold 12 Month Price Chart

US Dollar Gold 12 Month Price Chart

ASX200 Seasonality

Date: 01-12-2025 16:42:01 | This table shows the monthly seasonality data for the ASX200 index.

XJO Jan Feb Mar Apr May Jun Jul Aug Sep Oct Nov Dec Total
2025 4.6% -4.2% -4.0% 3.6% 3.5% 1.5% 2.3% 2.1% -0.9% -3.2% 5.4%
2024 -0.5% 2.1% 1.8% -4.0% 1.7% 0.6% 4.4% 0.2% 2.0% -1.3% 3.5% -3.4% 7.1%
2023 8.0% -3.3% -0.4% 1.5% -3.1% 1.9% 2.8% -2.3% -3.4% -2.8% 3.4% 7.8% 10.3%
2022 -7.7% 1.3% 5.6% -2.0% -1.5% -9.6% 6.9% -2.1% -5.7% 8.1% 5.4% -5.6% -6.8%
2021 -0.3% 1.9% 0.6% 2.9% 1.6% 1.7% 3.1% 0.5% -4.5% 2.6% -1.8% 4.9% 13.1%
2020 4.9% -7.7% -17.7% -0.2% 10.9% 2.0% -0.1% 0.5% -1.4% 1.3% 10.7% 1.5% 4.6%
2019 5.5% 5.6% 0.4% 2.6% -0.9% 5.2% 2.1% -3.1% 2.5% -1.1% 2.9% -3.8% 17.9%
2018 -0.4% -0.4% -4.4% 4.6% -0.4% 3.1% 1.6% 0.6% -2.2% -5.4% -1.2% -3.7% -8.2%
2017 -2.0% 1.6% 2.7% 1.6% -3.9% -0.1% 0.0% -0.1% 0.2% 3.1% 1.0% 1.5% 5.8%
2016 -4.8% -3.2% 4.1% 3.1% 2.6% -2.7% 6.8% -2.8% 0.1% -2.2% 2.3% 5.4% 8.7%
2015 4.0% 5.9% -1.1% -1.7% -0.9% -4.8% 4.4% -8.6% -3.6% 2.9% 0.0% 2.5% -1.1%
2014 -3.0% 4.1% -0.2% 1.7% 0.5% -2.2% 4.4% -0.1% -6.0% 4.4% -5.8% 3.9% 1.9%
2013 4.9% 4.6% -2.7% 4.5% -5.1% -4.4% 7.3% 2.7% 0.6% 4.0% -2.7% 1.4% 15.1%
2012 4.0% 0.0% 1.5% 1.6% -7.3% 1.4% 3.3% 1.1% 1.7% 2.9% -0.2% 3.2% 13.1%
2011 0.2% 1.6% 0.1% -0.3% -2.4% -2.1% -2.4% -4.5% -6.7% 7.2% -4.1% -0.5% -13.8%
2010 -7.1% 3.6% 4.0% -1.4% -7.8% -2.9% 5.6% -3.0% 4.1% 2.5% -2.4% 3.5% -1.4%
2009 -6.0% -7.1% 10.2% 5.6% 3.0% 1.6% 7.3% 5.5% 5.9% -4.3% 3.5% 3.6% 28.8%
2008 -10.9% 0.0% -5.2% 4.5% 1.2% -7.9% -4.6% 2.8% -10.1% -12.7% -8.4% 1.1% -50.1%
2007 1.8% 1.0% 1.4% 4.2% 2.4% -0.8% -1.9% 1.7% 5.1% 2.9% -3.3% -3.0% 11.6%
2006 3.2% -0.2% 4.2% 3.5% -5.8% 1.4% -1.7% 2.6% 1.3% 4.0% 1.8% 3.4% 17.7%
2005 1.4% 1.6% -1.5% -2.4% 2.4% 4.2% 2.3% 1.6% 4.4% -3.9% 3.9% 3.0% 17.0%
2004 -0.8% 3.2% 1.0% -0.4% 1.7% 2.1% 0.3% 0.2% 3.2% 3.4% 3.7% 3.1% 20.8%
2003 -2.3% -5.3% 3.0% 4.3% 1.0% -0.4% 3.1% 2.7% -1.1% 3.2% -3.1% 4.1% 9.2%
2002 1.2% -1.4% -0.1% -1.8% 0.7% -4.3% -4.4% 1.5% -5.1% 2.4% 1.3% -1.8% -11.8%
2001 3.3% -0.4% -4.0% 4.2% 1.5% 1.7% -3.3% -1.5% -5.4% 4.9% 2.7% 2.5% 6.2%
2000 1.8% 0.9% -1.0% -0.7% 7.5% -1.8% 1.4% 0.1% -1.4% 0.6% -1.2% 6.2%
Average -0.1% 0.4% 0.2% 1.4% -0.3% -0.3% 1.8% -0.1% -1.0% 1.0% 0.6% 1.3% 4.9%
Positive 12 16 15 15 13 13 16 15 13 16 15 17 18
Negative 12 9 10 10 12 12 9 10 12 9 10 8 7
Since 2009
Average 0.0% 0.7% 0.3% 1.3% -0.8% -0.7% 3.6% -1.0% -1.0% 1.4% 0.9% 1.4% 5.9%
Positive 7 11 9 9 5 7 12 6 7 10 8 10 10
Negative 8 4 6 6 10 8 3 9 8 5 7 5 5

S&P ASX200 12 Month Price Chart

S&P ASX200 12 Month Price Chart

ASX Best Performers 7 Days

Date: 30-11-2025 20:06:26 | This table shows the top 20 companies in my database with the best performance on the ASX in the last 7 days.

7 Days Ticker Name Sector
56.50% SRL Sunrise Energy Metals Limited Pollution & Treatment Controls
50.00% EXR Elixir Energy Limited Oil & Gas E&P
48.91% MTM Metallium Limited Other Industrial Metals & Mining
25.93% WR1 Winsome Resources Limited Other Industrial Metals & Mining
21.21% SVL Silver Mines Limited Farm Products
20.95% GTK Gentrack Group Limited Software – Infrastructure
20.94% HMC HMC Capital Limited REIT – Diversified
20.48% AIS Aeris Resources Limited Other Industrial Metals & Mining
20.45% GLN Galan Lithium Limited Other Industrial Metals & Mining
19.57% CRN Coronado Global Resources Inc. Coking Coal
19.38% NSR National Storage REIT REIT – Industrial
19.25% WEB Web Travel Group Limited Travel Services
18.18% LBL LaserBond Limited Specialty Industrial Machinery
17.31% IMM Immutep Limited Biotechnology
17.02% PMT PMET Resources Inc. Other Industrial Metals & Mining
16.81% AQZ Alliance Aviation Services Limited Airports & Air Services
16.51% PDI Predictive Discovery Limited Gold
16.31% HCW HealthCo Healthcare and Wellness REIT REIT – Healthcare Facilities
16.31% MSB Mesoblast Limited Biotechnology
15.91% CTT Cettire Limited Luxury Goods

ASX Worst Performers Last 7 Days

Date: 30-11-2025 20:06:22 | This table shows the top 20 companies in my database with the worst performance on the ASX in the last 7 days.

7 Days Ticker Name Sector
-28.12% EZZ EZZ Life Science Holdings Limited Biotechnology
-20.32% ^VIX CBOE Volatility Index Index
-17.53% TPW Temple & Webster Group Ltd Specialty Retail
-16.67% X2M X2M Connect Limited Scientific & Technical Instruments
-13.57% VEE VEEM Ltd Aerospace & Defense
-9.79% AEF Australian Ethical Investment Limited Asset Management
-7.57% WAF West African Resources Limited Gold
-6.91% BEN Bendigo and Adelaide Bank Limited Banks – Regional
-6.78% RPM RPM Automotive Group Limited Auto Parts
-6.78% CYG Coventry Group Ltd Industrial Distribution
-6.47% BRI Big River Industries Limited Lumber & Wood Production
-6.45% SUN Suncorp Group Limited Insurance – Property & Casualty
-6.41% WSI WestStar Industrial Limited Engineering & Construction
-5.93% CNI Centuria Capital Group REIT – Diversified
-5.56% PRO Prophecy International Holdings Limited Software – Application
-5.49% FWD Fleetwood Limited Engineering & Construction
-5.32% HVN Harvey Norman Holdings Limited Specialty Retail
-5.26% MGR Mirvac Group REIT – Diversified
-4.92% KYP Kinatico Ltd Information Technology Services
-4.68% IGL IVE Group Limited Advertising Agencies

ASX Worst Performers Last 1 Year

Date: 30-11-2025 20:06:33 | This table shows the top 20 companies in my database with the worst performance on the ASX in the last year.

1 Year Ticker Name Sector
-93.23% MDR Adheris Health Limited Health Information Services
-87.82% BSA BSA Limited Engineering & Construction
-82.61% CLG Close the Loop Ltd Waste Management
-73.98% IMU Imugene Limited Biotechnology
-71.27% NXL Nuix Limited Software – Application
-70.38% AVH AVITA Medical, Inc. Medical Devices
-69.91% PRO Prophecy International Holdings Limited Software – Application
-68.75% X2M X2M Connect Limited Scientific & Technical Instruments
-68.43% FND Findi Limited Software – Infrastructure
-68.11% HMC HMC Capital Limited REIT – Diversified
-67.50% APX Appen Limited Information Technology Services
-66.31% CRN Coronado Global Resources Inc. Coking Coal
-64.01% STP Step One Clothing Limited Apparel Retail
-62.14% MYR Myer Holdings Limited Department Stores
-59.67% AX1 Accent Group Limited Apparel Retail
-58.82% ANG Austin Engineering Limited Farm & Heavy Construction Machinery
-58.65% CYG Coventry Group Ltd Industrial Distribution
-57.79% IEL IDP Education Limited Education & Training Services
-56.58% OFX OFX Group Limited Capital Markets
-54.82% PEN Peninsula Energy Limited Uranium

ASX Best Performers 1 Year

Date: 30-11-2025 20:06:27 | This table shows the top 20 companies in my database with the best performance on the ASX in the last year.

1 Year Ticker Name Sector
2778% SRL Sunrise Energy Metals Limited Industrials
580% MTM Metallium Limited Basic Materials
350% BGD Barton Gold Holdings Limited Basic Materials
292% SGQ St George Mining Limited Basic Materials
254% EOS Electro Optic Systems Holdings Limited Industrials
232% 4DX 4DMedical Limited Healthcare
217% PNR Pantoro Gold Limited Basic Materials
208% EOL Energy One Limited Technology
194% KCN Kingsgate Consolidated Limited Basic Materials
186% AIS Aeris Resources Limited Basic Materials
185% DRO DroneShield Limited Industrials
176% RRL Regis Resources Limited Basic Materials
167% SGI Stealth Group Holdings Ltd Industrials
163% RSG Resolute Mining Limited Basic Materials
162% WGN Wagners Holding Company Limited Basic Materials
160% APE Eagers Automotive Limited Consumer Cyclical
155% GNP GenusPlus Group Ltd Industrials
153% GMD Genesis Minerals Limited Basic Materials
153% CXO Core Lithium Ltd Basic Materials
151% COG COG Financial Services Limited Financial Services

ASX Worst Performers Last 30 Days

Date: 30-11-2025 20:06:33 | This table shows the top 20 companies in my database with the worst performance on the ASX in the last 30 days.

30 Days Ticker Name Sector
-99.89% RKT RocketDNA Ltd. Computer Hardware
-48.30% DRO DroneShield Limited Aerospace & Defense
-45.06% AQZ Alliance Aviation Services Limited Airports & Air Services
-39.65% VEE VEEM Ltd Aerospace & Defense
-34.82% TPW Temple & Webster Group Ltd Specialty Retail
-32.19% TPG TPG Telecom Limited Telecom Services
-27.94% WBT Weebit Nano Limited Semiconductors
-26.73% EOS Electro Optic Systems Holdings Limited Aerospace & Defense
-26.33% CU6 Clarity Pharmaceuticals Ltd Biotechnology
-25.00% TTT Titomic Limited Specialty Industrial Machinery
-25.00% MVP Medical Developments International Limited Drug Manufacturers – Specialty & Generic
-24.85% IPX IperionX Limited Other Industrial Metals & Mining
-24.66% CRN Coronado Global Resources Inc. Coking Coal
-23.81% EZZ EZZ Life Science Holdings Limited Biotechnology
-23.24% ERD EROAD Limited Software – Infrastructure
-23.08% X2M X2M Connect Limited Scientific & Technical Instruments
-22.64% ANG Austin Engineering Limited Farm & Heavy Construction Machinery
-22.01% QOR Qoria Limited Software – Infrastructure
-21.65% FDV Frontier Digital Ventures Limited Internet Content & Information
-21.48% AX1 Accent Group Limited Apparel Retail

ASX Best Performers Last 30 Days

Date: 30-11-2025 20:06:24 | This table shows the top 20 companies in my database with the best performance on the ASX in the last 30 days.

30 Days Ticker Name Sector
80.00% CXO Core Lithium Ltd Basic Materials
70.97% GLN Galan Lithium Limited Basic Materials
65.52% SGI Stealth Group Holdings Ltd Industrials
57.65% CXL Calix Limited Basic Materials
56.41% ONE Oneview Healthcare PLC Healthcare
54.55% WR1 Winsome Resources Limited Basic Materials
50.00% EXR Elixir Energy Limited Energy
50.00% M7T Mach7 Technologies Limited Healthcare
47.11% SRL Sunrise Energy Metals Limited Industrials
39.76% LNW Light & Wonder, Inc. Consumer Cyclical
37.50% PMT PMET Resources Inc. Basic Materials
36.36% SDV SciDev Limited Basic Materials
31.11% WGN Wagners Holding Company Limited Basic Materials
29.89% ELV Elevra Lithium Limited Basic Materials
26.07% IGO IGO Limited Basic Materials
24.84% HMC HMC Capital Limited Real Estate
24.41% CYC Cyclopharm Limited Healthcare
23.40% MAH Macmahon Holdings Limited Basic Materials
23.19% MVF Monash IVF Group Limited Healthcare
22.73% PLS PLS Group Limited Basic Materials

ASX Worst Performers Today

Date: 30-11-2025 19:34:41 | This table shows the companies with the worst performance on the ASX today.

Today Ticker Name Sector
-25.54% VEE VEEM Ltd Aerospace & Defense
-8.62% XRG xReality Group Limited Leisure
-8.60% EZZ EZZ Life Science Holdings Limited Biotechnology
-6.25% PLY PlaySide Studios Limited Electronic Gaming & Multimedia
-6.12% JAN Janison Education Group Limited Software – Application
-5.88% SNT Syntara Limited Drug Manufacturers – Specialty & Generic
-5.25% SKS SKS Technologies Group Limited Electrical Equipment & Parts
-5.00% ^VIX CBOE Volatility Index Index
-4.76% CCX City Chic Collective Limited Apparel Retail
-4.00% KMD KMD Brands Limited Apparel Manufacturing
-3.72% APE Eagers Automotive Limited Auto & Truck Dealerships
-3.60% QAL Qualitas Limited Asset Management
-3.57% SUN Suncorp Group Limited Insurance – Property & Casualty
-3.51% RPM RPM Automotive Group Limited Auto Parts
-3.48% CNI Centuria Capital Group REIT – Diversified
-3.44% KPG Kelly Partners Group Holdings Limited Specialty Business Services
-3.12% BET Betmakers Technology Group Ltd Gambling
-2.93% FID Fiducian Group Ltd Asset Management
-2.84% RZI Raiz Invest Limited Software – Infrastructure
-2.67% WSI WestStar Industrial Limited Engineering & Construction

ASX Best Performers Today

Date: 30-11-2025 20:06:25 | This table shows the top 20 companies in my database with the best performance on the ASX today.

Today Ticker Name Sector
16.18% CYC Cyclopharm Limited Medical Distribution
13.33% PRO Prophecy International Holdings Limited Software – Application
13.33% WR1 Winsome Resources Limited Other Industrial Metals & Mining
12.36% AIS Aeris Resources Limited Other Industrial Metals & Mining
11.76% RKT RocketDNA Ltd. Computer Hardware
11.11% SVL Silver Mines Limited Farm Products
10.53% EXR Elixir Energy Limited Oil & Gas E&P
10.42% GLN Galan Lithium Limited Other Industrial Metals & Mining
10.00% MDR Adheris Health Limited Health Information Services
10.00% BMT Beamtree Holdings Limited Health Information Services
9.84% CXL Calix Limited Specialty Chemicals
9.51% SHV Select Harvests Limited Packaged Foods
9.01% HMC HMC Capital Limited REIT – Diversified
8.82% GAL Galileo Mining Ltd Other Industrial Metals & Mining
7.84% CRN Coronado Global Resources Inc. Coking Coal
7.69% TTT Titomic Limited Specialty Industrial Machinery
7.40% TPW Temple & Webster Group Ltd Specialty Retail
7.37% MTM Metallium Limited Other Industrial Metals & Mining
7.36% SYL Symal Group Limited Engineering & Construction
7.34% BGD Barton Gold Holdings Limited Gold

ASX Sector Performance

Date: 01-12-2025 16:41:02 | This table shows the latest performance of the different sectors on the ASX.

Index Sector Market cap Div yield % Change % Volume Industries Stocks
^AXFJ Finance 1.08 TAUD 3.70% -0.81% 2.43 M 13 167
^AXMJ Non-Energy Minerals 991.38 BAUD 2.53% 0.38% 3.82 M 6 715
^AXHJ Health Technology 247.72 BAUD 1.49% -2.17% 3.65 M 5 111
^AXIJ Retail Trade 214.92 BAUD 2.89% -0.25% 1.51 M 7 34
^AXDJ Consumer Services 135.93 BAUD 1.50% -0.18% 848.38 K 9 53
^AXDJ Transportation 133.8 BAUD 3.68% -0.32% 2.84 M 6 19
^AXNJ Commercial Services 132.63 BAUD 1.17% -1.05% 461.58 K 4 54
^AXEJ Technology Services 130.98 BAUD 0.73% -1.66% 1.15 M 4 157
^AXUJ Energy Minerals 128.98 BAUD 5.64% 0.42% 4.36 M 4 98
^AXTJ Communications 76.94 BAUD 4.07% -0.75% 13.14 M 3 10
^AXHJ Miscellaneous 62.36 BAUD 4.37% -0.14% 481.29 K 2 490
^AXDJ Process Industries 59.9 BAUD 4.50% -0.80% 1.81 M 7 54
^AXNJ Health Services 58.95 BAUD 1.68% -0.49% 457.91 K 3 19
^AXMJ Utilities 51.74 BAUD 4.67% -1.12% 697.91 K 4 19
Distribution Services 44.46 BAUD 2.19% -2.05% 1.54 M 4 29
^AXNJ Industrial Services 43.36 BAUD 3.18% -0.93% 1.49 M 4 43
^AXNJ Producer Manufacturing 30.38 BAUD 2.12% -1.05% 1.23 M 8 45
^AXSJ Consumer Non-Durables 15.88 BAUD 3.82% -1.58% 3.51 M 8 28
^AXDJ Consumer Durables 14.16 BAUD 1.74% -1.09% 261.8 K 8 16
^AXIJ Electronic Technology 10.28 BAUD 0.07% -1.86% 4.82 M 7 34
^AXJO S&P/ASX 200 8565.2 -48.9 -0.57% 200
^AXSO S&P/ASX SMALL ORDINARIES [XSO] 3692.5 -29.8 -0.81% 171

ASX 52 Week Lows

Date: 30-11-2025 20:06:24 | This table shows companies that have reached their 52-week lows on the ASX.

52 Week Low Name Industry Last Traded Price Price 360 Days Ago Change %
DUB Dubber Corporation Limited Software – Application $0.016 $0.02 -20.00%
FND Findi Limited Software – Infrastructure $1.550 $4.91 -68.43%
NEC Nine Entertainment Co. Holdings Limited Entertainment $1.090 $0.84 29.52%
STX Strike Energy Limited Oil & Gas E&P $0.110 $0.20 -46.34%
SUN Suncorp Group Limited Insurance – Property & Casualty $17.560 $21.97 -20.07%
X2M X2M Connect Limited Scientific & Technical Instruments $0.010 $0.03 -68.75%

ASX 52 Week Highs

Date: 30-11-2025 20:06:23 | This table shows companies that have reached their 52-week highs on the ASX.

52 Week High Name Industry Last Traded Price Price 360 Days Ago Change %
AAPL Apple Inc. Consumer Electronics $278.850 $241.946 15.25%
ABY Adore Beauty Group Limited Specialty Retail $1.275 $0.955 33.51%
ANN Ansell Limited Medical Instruments & Supplies $37.490 $33.140 13.12%
AZJ Aurizon Holdings Limited Railroads $3.580 $3.209 11.56%
CKF Collins Foods Limited Restaurants $11.680 $7.830 49.17%
CMM Capricorn Metals Ltd Gold $14.650 $6.980 109.89%
DDR Dicker Data Limited Electronics & Computer Distribution $10.680 $8.291 28.82%
DOW Downer EDI Limited Engineering & Construction $7.910 $5.712 38.48%
EHL Emeco Holdings Limited Rental & Leasing Services $1.380 $0.935 47.59%
ELV Elevra Lithium Limited Other Industrial Metals & Mining $5.780 nan nan%
EVN Evolution Mining Limited Gold $11.880 $5.019 136.70%
EXR Elixir Energy Limited Oil & Gas E&P $0.063 $0.041 53.66%
FMG Fortescue Ltd Other Industrial Metals & Mining $21.410 $18.566 15.32%
GLN Galan Lithium Limited Other Industrial Metals & Mining $0.265 $0.120 120.83%
GOOGL Alphabet Inc. Internet Content & Information $320.180 $171.882 86.28%
LBL LaserBond Limited Specialty Industrial Machinery $0.650 $0.565 15.14%
MAH Macmahon Holdings Limited Other Industrial Metals & Mining $0.580 $0.345 68.18%
NSR National Storage REIT REIT – Industrial $2.710 $2.309 17.35%
NU Nu Holdings Ltd. Banks – Regional $17.390 $11.960 45.40%
NWH NRW Holdings Limited Conglomerates $5.510 $3.697 49.02%
PMT PMET Resources Inc. Other Industrial Metals & Mining $0.550 $0.290 89.66%
PRN Perenti Limited Other Industrial Metals & Mining $2.930 $1.237 136.90%
PRU Perseus Mining Limited Gold $5.650 $2.744 105.88%
QUAL Vaneck Msci International Quality Etf ETF $62.400 $57.555 8.42%
QUB Qube Holdings Limited Integrated Freight & Logistics $4.860 $3.875 25.41%
RKT RocketDNA Ltd. Computer Hardware $0.019 $0.013 46.15%
RRL Regis Resources Limited Gold $7.380 $2.674 176.02%
RUL RPMGlobal Holdings Limited Software – Application $4.930 $3.340 47.60%
SGM Sims Limited Steel $17.100 $12.817 33.42%
SI=F USD Silver Price Silver nan $31.134 nan%
SMP Smartpay Holdings Limited Software – Infrastructure nan $0.600 nan%
SPZ Smart Parking Limited Infrastructure Operations $1.400 $0.915 53.01%
SYL Symal Group Limited Engineering & Construction $2.770 $1.785 55.19%
VNT Ventia Services Group Limited Infrastructure Operations $5.900 $4.178 41.23%
WGX Westgold Resources Limited Gold $6.100 $2.946 107.04%

What is Free Float?

Definition and Significance for Listed Companies

Free float refers to the percentage of a company’s shares that are available for public trading on the stock market. It excludes shares held by insiders, such as founders, executives, and strategic institutional investors. These are the shares that retail and institutional investors can trade without restrictions.

Companies with a smaller public share availability often have founders or leadership teams retaining significant ownership stakes. This can signal strong alignment between management and shareholder interests. As a result, it may attract investors looking for founder-led businesses with a long-term growth vision and strategic focus.

For dual-listed companies, the available public shares on each exchange typically reflect only what is tradable in that specific market. Investors should evaluate these shares separately for each listing to fully understand liquidity.

A higher share availability generally means better liquidity. This makes it easier to trade without significantly affecting the stock price. In contrast, stocks with limited public availability may experience greater price volatility. This volatility, caused by restricted supply, often attracts investors seeking growth opportunities in tightly held companies.

While this metric provides insights into a stock’s liquidity and ownership structure, it’s essential to look beyond it. Factors like market capitalization, industry trends, and company fundamentals play a key role in making sound investment decisions.

Free Float and the Impact of Index Inclusion

An interesting dynamic of this metric lies in its connection to index inclusion, especially for indices like the ASX 300 and ASX 200. Companies with a value of publicly available shares between 200 million and 1.5 billion AUD often reach a critical range. At this point, they may qualify for these indices and attract significant attention.

When a company nears inclusion criteria, index funds and ETFs tracking these indices must purchase shares to replicate the composition. This forced buying drives up demand and often the share price. In addition, active investors may anticipate such inclusions. They often engage in preemptive buying to profit from the expected price appreciation, further amplifying the effect.

This phenomenon highlights the importance of monitoring a company’s tradable shares. Index inclusion can bring short-term price gains and improve liquidity. However, investors must focus on the company’s fundamentals to assess its long-term growth potential beyond this temporary boost.

Screening for Investment Opportunities

A quick filter of the almost 500 companies I follow based on a public availability of less than 35% and a market value of between $200M and $1.5B reveals interesting results. This group includes a mix of founder-led and dual-listed companies, where insider holdings or cross-listing arrangements limit the public availability of shares.

What is Free Float? - a list of companies with low free float and free float value between 200M and 1.5B

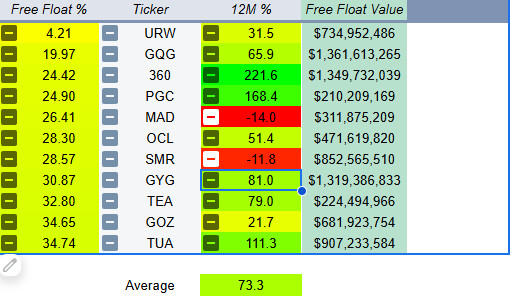
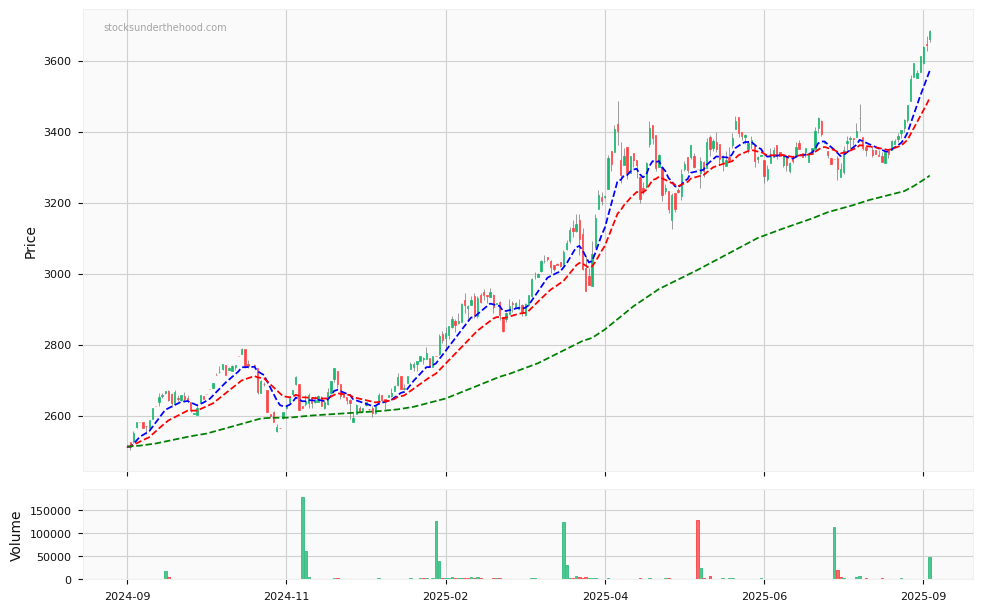
Some strong performances among these companies have likely been enhanced by their proximity to or recent qualification for index inclusion. For example, ASX:GYG stands out as an interesting case, as it seems the recent float was structured to intentionally limit the public share availability to drive demand.


Disclaimer: This information is provided purely for educational purposes. It takes no account of an individual’s personal financial circumstances and hence can in no way constitute financial advice. The above data may be subject to errors or inconsistencies for which the author takes no liability. It is imperative that all investors do their own research or if they need advice, seek it from a qualified financial adviser.

What is the Rule of 40?

The Rule of 40: A Quick Guide for Evaluating Growth Companies

The Rule of 40 is a popular framework for evaluating growth-stage companies. It combines revenue growth rate and a profitability metric to measure business sustainability. On this site EBITDA margin is used as the profitability component. The formula is simple: revenue growth rate plus EBITDA margin should total at least 40%.

Using EBITDA margin has distinct advantages. EBITDA (earnings before interest, taxes, depreciation, and amortization) focuses on a company’s operating performance. It excludes non-operational expenses, making it a better indicator of core profitability. For growth companies, where net profits might be negative, EBITDA margin provides a clearer picture of operational efficiency.

This approach balances growth and financial health. Companies surpassing 40% demonstrate strong growth while maintaining efficient cost structures. It also adjusts for industry variations, making it useful for businesses like SaaS companies, where EBITDA is often a key benchmark. In historical analysis of successful SaaS companies, a combined score of 40% was seen as a common characteristic of well-performing businesses.

However, EBITDA margin has its limitations. It ignores capital expenditures, debt repayments, and working capital changes. A high EBITDA margin might not translate to strong cash flows or long-term viability. Relying solely on the Rule of 40 could overlook critical financial pressures or misrepresent sustainability.

The Rule of 40, using EBITDA margin, is a valuable tool for investors and analysts. It highlights the trade-off between growth and operational efficiency. Still, it should be part of a broader assessment, incorporating cash flow and balance sheet health for a complete picture.

An Example

I ran a quick filter over the almost 500 companies that I follow and this was the result:

What is the rule of 40? A stock filter based on basic criteria and the rule of 40

This is the “Who’s Who” of the best performing companies on the ASX (and a couple of US stocks). Only 3 companies failed to increase in price this year but all of those (except IFM) are coming off a great year last-year.

This was the criteria that I used:

  • Rule of 40 value greater than 40
  • Net Debt / Equity % less than 1 (this means companies with low to no debt)
  • Exclude sectors Property, Utilities, Basic Materials and Consumer Cyclicals.

The latest list of Rule Of 40 Stocks can be viewed HERE.


Disclaimer: This information is provided purely for educational purposes. It takes no account of an individual’s personal financial circumstances and hence can in no way constitute financial advice. The above data may be subject to errors or inconsistencies for which the author takes no liability. It is imperative that all investors do their own research or if they need advice, seek it from a qualified financial adviser.

What is the Rule of 40?